the Creative Commons Attribution 4.0 License.
the Creative Commons Attribution 4.0 License.
 | 26 Aug 2024
Environmental sensitivity of the Caribbean economic growth rate
Mark R. Jury
The year-over-year changes in economic growth across the Caribbean Antilles islands demonstrate sensitivity to climatic conditions. Daily wind and rainfall exceedances from passing storms are negatively related to the gross domestic product (GDP). Field regression of the GDP time series from 1971 to 2022 for Puerto Rico and the neighboring Antilles islands reveals links with eastern Pacific sea temperature. A zonal overturning atmospheric circulation over the equatorial Atlantic emerges in composite analysis. Alternating at an approximate 7-year interval, it modulates weather events and economic prosperity in the Caribbean. A multivariate algorithm is developed to predict changes in the annual GDP growth rate. The most influential predictor is precipitable water in the equatorial Atlantic 1 year earlier. Reduced moisture overlain by westerly winds in a global bottleneck at 5° S–5° N, 20–40° W tends to suppress Caribbean storms, leading to economic prosperity in the following year. Statistical methods and risk-reduction strategies are outlined.
- Article
(7979 KB) - Full-text XML
- BibTeX
- EndNote


Anticipating climate variability and extreme weather events can ensure more sustainable economic growth as the Earth's limited resources come under increasing population pressure. Advances in environmental satellite measurements and coupled model data assimilation have given us a better understanding of air–land–sea interactions at daily to decadal timescales. Institutional systems are developed to exploit these advances in support of sustainable development, through risk management of extreme weather events embedded within anomalous seasonal climate. Long-range forecasts are available for indirect application to many activities to anticipate market supply–demand, macroscale profitability, food and water resources, and re-insurance needs. Uptake of this information can minimize the downstream consequences of a fluctuating economic growth rate, which involve a plethora of non-climate influences, such as political stability.
Extreme weather events can have short-term negative and long-term positive consequences (Wu et al., 2019). Places hit by tropical cyclones (TCs) often see outward migration toward better opportunities and living conditions (Spencer and Urquhart, 2018). Mobility tends to favor wealthier groups, leaving the poor community exposed to a drop in household consumption and health. On the upside, post-disaster reconstruction can inject funds for development, leading to increased employment in manufacturing and services. Although disasters undermine the socioeconomic fabric, recovery creates opportunities for innovation of disaster-resilient infrastructure that accumulates material and human capital.
Most efforts to forecast seasonal climate in the Caribbean have targeted rainfall and TC frequency (Guido et al., 2016). Some work has been devoted to the climate sensitivity of the gross domestic product (GDP). Bertinelli and Strobl (2013) developed metrics for Caribbean TC impacts using satellite-observed nocturnal light intensity and the sum of maximum wind. They found temporary and localized damage from TC landfall on the Antilles islands that correlated with the GDP.
Although the GDP is a useful metric of economic performance and may be compared with environmental impacts after adjustment for inflation and population, it does not fully account for contributions from the informal sector. These appear through consumption taxes that are recycled via government spending on infrastructure. Economic activity in the Caribbean is diversified from agriculture and industry toward service delivery, as indicated in the Appendix (Fig. A1). The individual economic sectors are interdependent and impacted collectively by extreme weather events, albeit with response lags that are immediate for localized flood and wind damage but delayed for widespread industrial production and recovery of services and coastal infrastructure. For example Hurricane Maria, which occurred in Puerto Rico in 2017, wiped out 80 % of crops (with a value of ∼ USD 500 million) but only 5 % of industrial facilities (with a value of ∼ USD 1 billion), while ongoing power outages induced a 30 % drop in jobs and prevented > USD 30 billion of service delivery in the following season (Moodys, 2017; Liberty, 2018).
Economic interdependence is common among adjacent nations, especially those engaged in specialized cross-border trade. Puerto Rico distributes manufactured items, while the Dominican Republic exports agricultural products to the neighboring islands of Jamaica, Dominica and Saint Lucia (FAO stat, 2024). Their economies tend to expand and contract together, despite differences in surface area, GDP size, population and external links. The Antilles islands share TC impacts on infrastructure and resources and have a mean population density of ∼250 inhabitants per square kilometer. The agricultural contribution to the Caribbean GDP is ∼7 % and per capita income averages ∼ USD 12 000 per annum (FAO stat, 2024) from production diversified toward recreation tourism. The aggregate economic output responds to climate fluctuations as seen below.
The Pacific El Niño–Southern Oscillation (ENSO) involves an anomalous Walker circulation over the equatorial Atlantic (Keenlyside and Latif, 2007). With the onset of the Pacific El Niño, zonal atmospheric overturning commences. Lower easterly/upper westerly winds lead to evaporative cooling of the tropical Atlantic sea surface temperature (SST) and reduced humidity for transient easterly waves (Jury and Enfield, 2010; Klotzbach, 2011; Jury and Nieves-Jiménez, 2021). The narrow equatorial trough over the Atlantic forms a “bottleneck” that amplifies global ENSO transmission and responses to Pacific upwelling (Carton and Huang, 1994; Tokinaga et al., 2019; Zhang et al., 2023).
It is hypothesized that coupling of the eastern Pacific ENSO with the equatorial Atlantic Walker circulation could offer a direct way of predicting changes in the Caribbean GDP. The following scientific questions are addressed:
-
Do fluctuations in the GDP growth rate in the Antilles islands respond to local weather impacts?
-
Can field regressions with the GDP growth rate inform predictive outcomes?
-
How sensitive is the Caribbean economy to climate fluctuations?
-
How can growth rate forecasts influence risk management decisions?
Numerical models simulate atmospheric responses to global climate forcing, but the direct prediction of economic trends involves unconstrained feedback. Thus, a statistical approach can be taken in which meteorological precursors are trained on objective resource data. Many Antilles islands, such as Puerto Rico, are fortunate to have a stable history of economic metrics. The empirical technique seeks to replicate fluctuations in prosperity over multiple decades using key indicators of the regional climate system in the preceding year (Jury, 2002).
The remainder of the paper is structured as follows: in Sect. 2, the data and methods are outlined, wherein the metrics are formulated; Sect. 3 provides results on the GDP growth rate links with daily weather exceedance, field regressions to establish key climate signals, the evaluation of cross-correlations, the composite analysis of winds and TC tracks, and a statistical multivariate regression at a 1-year lead time; finally, a concluding discussion is provided in Sect. 4.
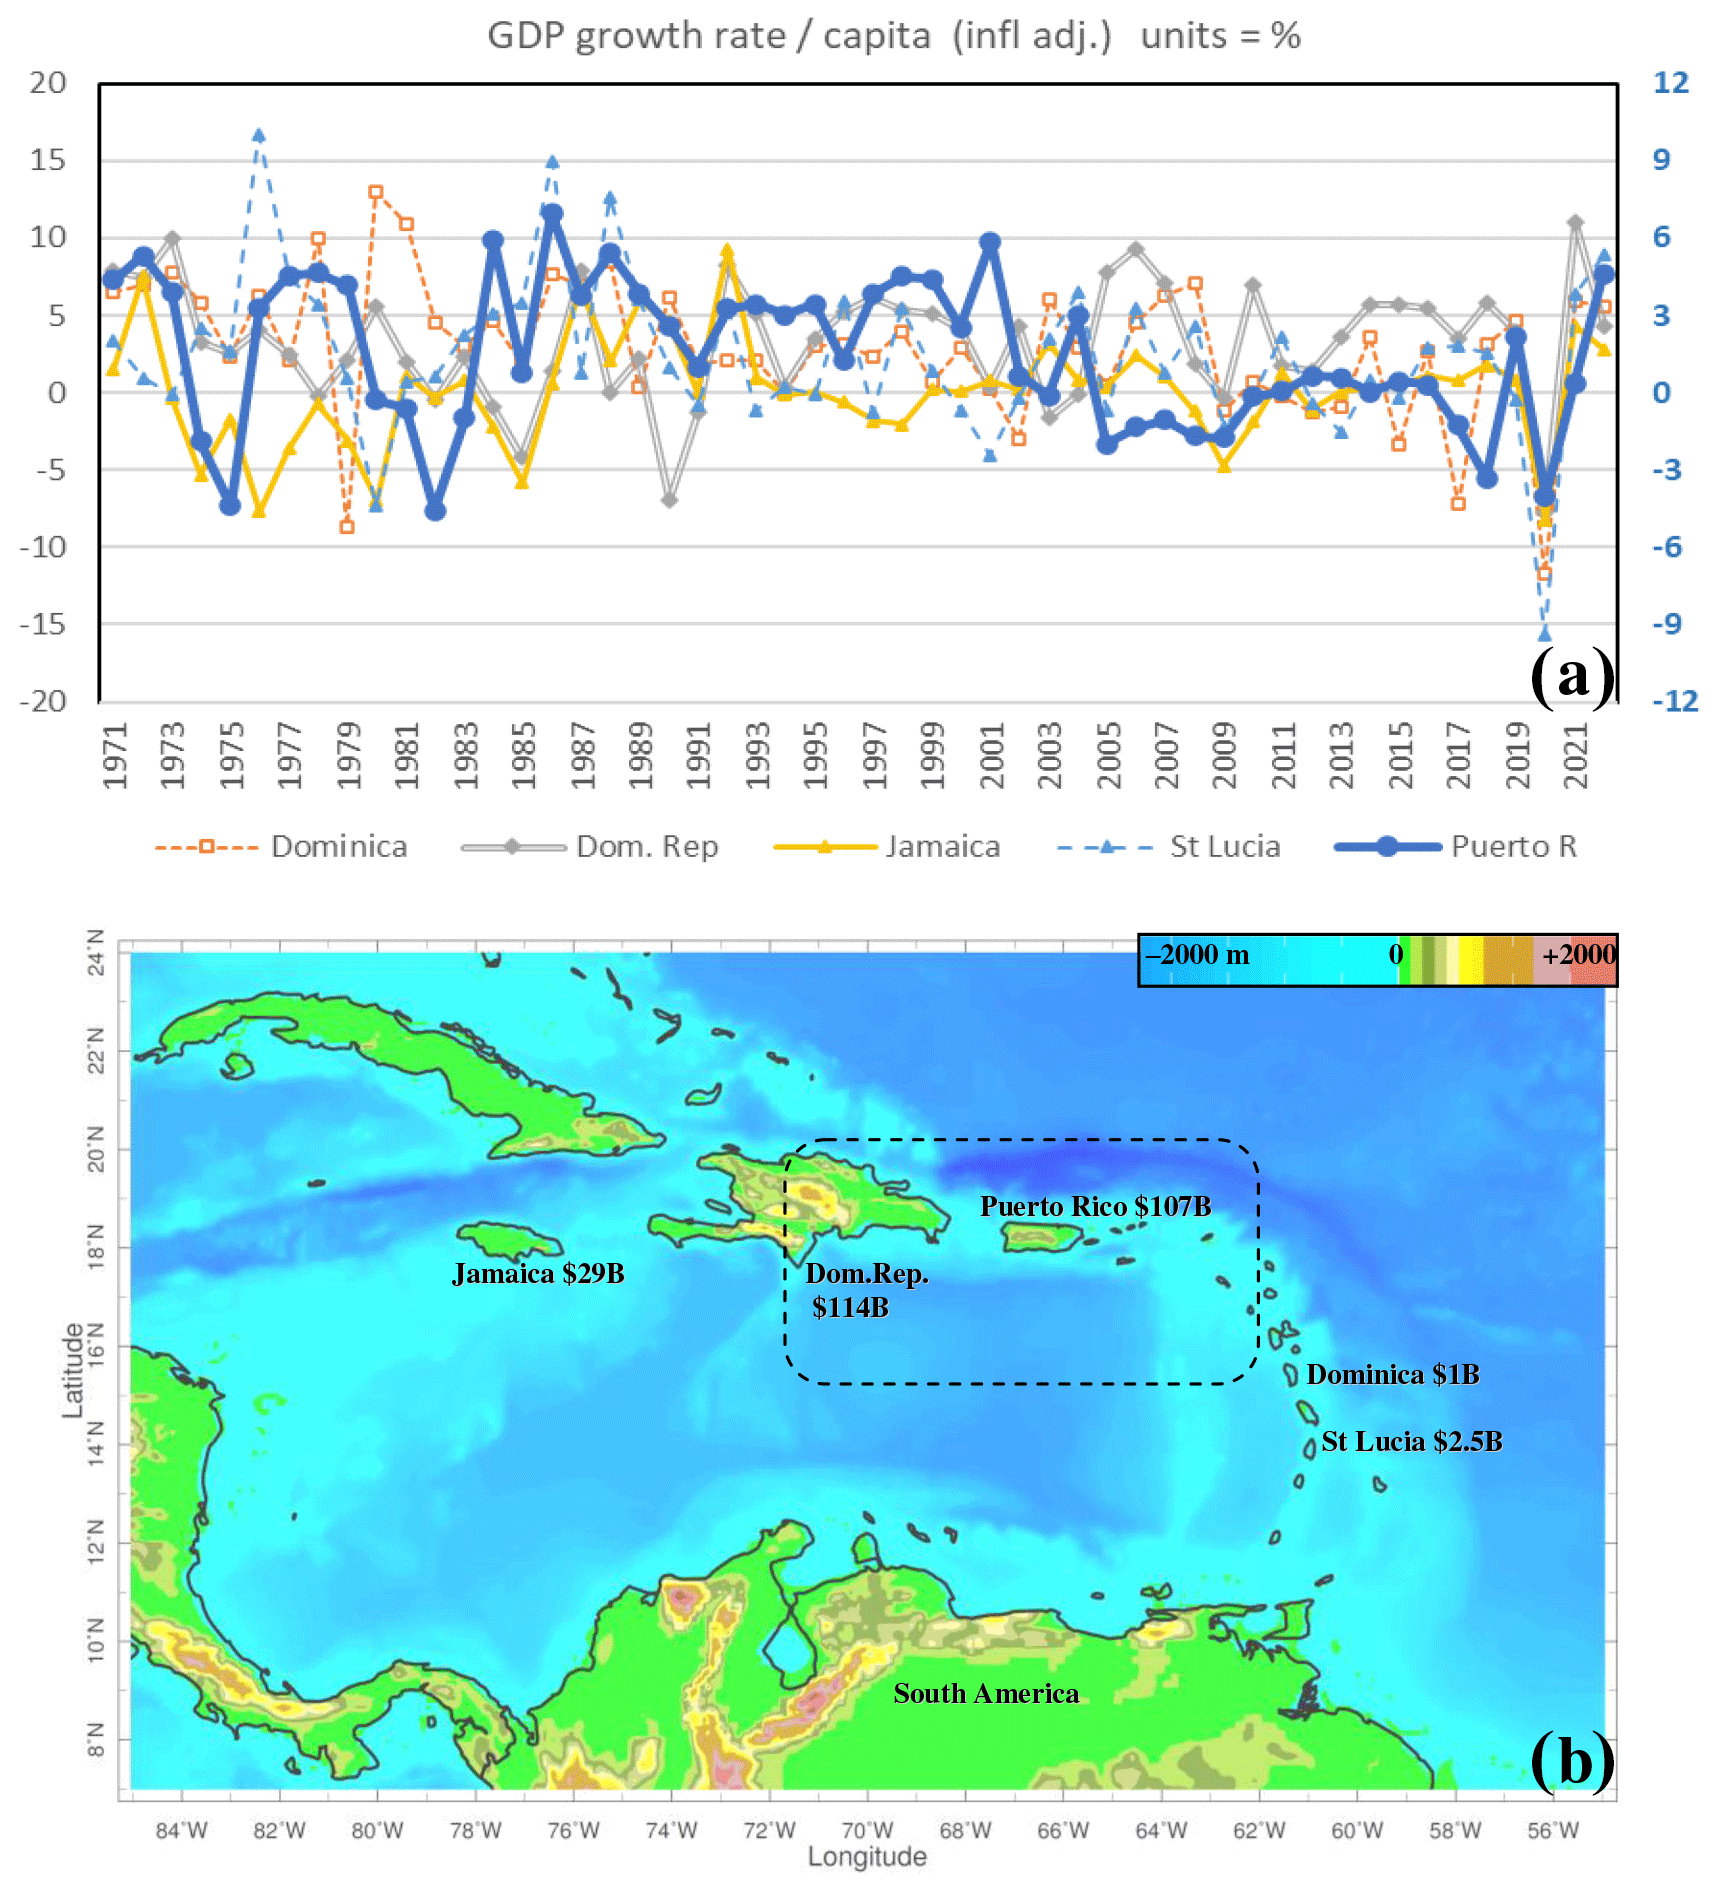
Figure 1(a) Time series of the GDP growth rate per capita (adjusted for inflation), expressed as the percentage of billion-dollar economies; Puerto Rico is shown on the right axis and using the thickest line. (b) Geography of target area, showing the total GDP; the dashed box outlines the Antilles subregion for impact proxies.
Table 1(a) Pairwise correlation values of combined and individual GDP growth rate time series for the Antilles islands (see Fig. 1a). (b) Correlation of the GDP growth rate with local impacts: sum of daily wind >10 m s−1, sum of daily rain >15 mm d−1 and annual net solar radiation in the preceding year, averaged over the Antilles area from 15 to 20° N and from 62 to 72° W. (c) Correlation of the GDP with respect to environmental predictors in the preceding year. Predictor indices are derived from the following parameters: Peru SST from 15° S–5° N, 100–70° W (Peru SST); equatorial Atlantic precipitable water from 5° S–5° N, 20–40° W (Atl p.water); Z 700 Spain from 35–48° N, 10–30° W (Z 7 Spain); Z 700 dipole subtraction of 20–37° N, 40–60° W from Spain (Z 7 dipole); U 200 Medit (where Medit refers to the Mediterranean Sea) from 30–40° N, 15–5° W (U 2 Medit); and U 200 equatorial Atlantic from 5° S–5° N, 10–30° W (U 2 eq At). Bold values are significant at >90 % confidence, N=52.

* Variables used in the multivariate algorithm.
Economic data on the annual GDP growth rate per capita adjusted for inflation in US dollars was obtained from the Food and Agricultural Organization statistical database for the period from 1971 to 2022. The time series (Fig. 1a) were cross-correlated and an Antilles combined index was formed from the annual GDP changes in Dominica, the Dominican Republic, Jamaica, Puerto Rico and Saint Lucia (Table 1a). The reader should note the GDP size: Dominica, USD 1 billion; the Dominican Republic, USD 114 billion; Jamaica, USD 29 billion; Puerto Rico, USD 107 billion; and Saint Lucia, USD 2.5 billion. Even small Antilles islands achieve noteworthy agricultural production: Dominica, USD 16 million from 750 km2; the Dominican Republic, USD 6.1 billion from 48 7000 km2; Jamaica, USD 1.2 billion from 11 000 km2; Puerto Rico, USD 561 million from 8900 km2; and Saint Lucia, USD 70 million from 617 km2 (values as of 2022). It is recognized that the GDP in less-developed circumstances may not capture all value-added production from the informal sector; thus, our main “target” is the Puerto Rican year-over-year growth rate adjusted for inflation and population.
To create meteorological proxies for economic impacts, European Reanalysis v5 (ERA5; Hersbach et al., 2020) daily maximum wind >10 m s−1 and rain >15 mm d−1 exceedances in the Antilles subregion (15–20° N, 62–72° W; Fig. 1b) were summed into annual values and cross-correlated with changes in the combined Antilles and the Puerto Rico GDP growth rate in the following year (Table 1b). Similarly, net solar radiation anomalies were calculated for the subregion and cross-correlated with the economic metrics over the period from 1971 to 2022. The Pearson product moment coefficients with reach 90 % confidence for N=52.
Given Puerto Rico's central position among the Antilles islands, its GDP growth rate time series was employed in point-to-field regressions: 35° S–45° N, 140–0° W; 1971–2022. Environmental fields included the Hadley SST (Rayner et al., 2003) and the ERA5 geopotential height at 700 hPa, precipitable water (Σq), and zonal wind at 200 hPa. The KNMI Climate Explorer statistical tool was used to construct regression maps over annual blocks at a 1-year lead time (e.g., 2021–2022 percent economic change vs. 2021 meteorological field). In addition to field regressions, the Puerto Rico GDP time series was ranked, and the top-10 and bottom-10 precursor years were identified: the top-10 years were +1971, 1976, 1979, 1983, 1985, 1987, 1997, 1998, 2000 and 2021, whereas the bottom-10 years were −1973, 1974, 1981, 2004, 2005, 2006, 2007, 2008, 2016 and 2017.
The IRI Climate Data Library statistical tool was used to form “positive-minus-negative” composites of wind and humidity as maps and as an equatorial height section. The NOAA TC database (Coast, 2024) was used to form composite track and intensity maps for the same positive and negative precursor years, around a 500 km radius centered on 17.5° N, 67° W.
A pool of eight candidate predictors were extracted from centers of action identified in the 1-year lead field regression maps covering the Pacific–Atlantic sector: 35° S–45° N, 140–0° W (using the KNMI Climate Explorer website). After pairwise cross-correlation with the combined Antilles and the Puerto Rico GDP growth rate time series, the number of predictors was reduced to six (Table 1c). Those predictors were submitted to multivariate regression (using MS Excel) and then reduced to four predictors via backward stepwise elimination, following checks for colinearity (e.g., that require the alignment of pairwise and multivariate correlation coefficients). The leading predictor – equatorial Atlantic precipitable water (5° S–5° N, 20–40° W) – was plotted against the Puerto Rico GDP growth rate, along with a third variable to assess the chance of false alarms (poor forecasts).
Annual economic metrics were evaluated for temporal autocorrelation, and monthly impact and predictor time series were filtered to retain cycles >18 months and subjected to wavelet spectral analysis to quantify persistent oscillations (using the KNMI Climate Explorer tool). The research approach is admittedly “broad-brush” and disregards non-climate influences. Furthermore “local” impacts are lumped into subregional indices that do not account for TC landfall. Nevertheless, statistical explorations pointed to the Atlantic Walker circulation (Tokinaga et al., 2019; Jury, 2024) as a valuable source of actionable outcomes.
The scope of work is directed toward the climate sensitivity of the Antilles GDP growth rate but excludes the following: threshold damage functions, statistical attenuation bias, the testing of prediction-policy links and the indirect sectoral responses that underrepresent social impacts.
3.1 Economic growth rate and impacts
The GDP growth rate time series for five Caribbean islands are presented in Fig. 1a in the context of location (Fig. 1b) and cross-correlation (Table 1a). The typical range of annual economic growth is ±10 %, and standard deviations vary from σ=5 for smaller economies to σ=3 for larger. Contributions to the combined index are positive (r=0.44 to 0.72), but r values were small between Puerto Rico and the Dominican Republic, indicating the diversity of economic activities and external links. The 2020 downturn from COVID is just one example of a non-climate influence (Fig. 1a); another is the flat spell in Puerto Rico after 2005 from accumulating deficits (GAO, 2018). Autocorrelation of the GDP time series at a 1-year lag is r=0.32; a 7-year cycle is detected, inferring that biennial fluctuations are constrained by financial momentum, leaving inter-decadal oscillations.
Although the Antilles islands often share the impacts of TCs, such as Hurricane Georges in 1998, the influence of daily wind and rain exceedances on GDP growth rate in the following year is minimal ( to −0.27; Table 1b) and not necessarily confined to extreme events. Explorations with alternate thresholds, lags and land-only metrics did not improve the association. The correlation of annual net solar radiation anomalies in the subregion gave positive r values that reached 0.28 for Puerto Rico. The weak correlations were unexpected and attest to the localized nature of TC impacts, as noted by Bertinelli and Strobl (2013). At least the wind and rain r values were negative and the combined-Antilles and Puerto Rico results were similar. The message is that non-climate influences on economic growth rate are substantial, and risk management decisions must account for those in parallel with environmental forcing.
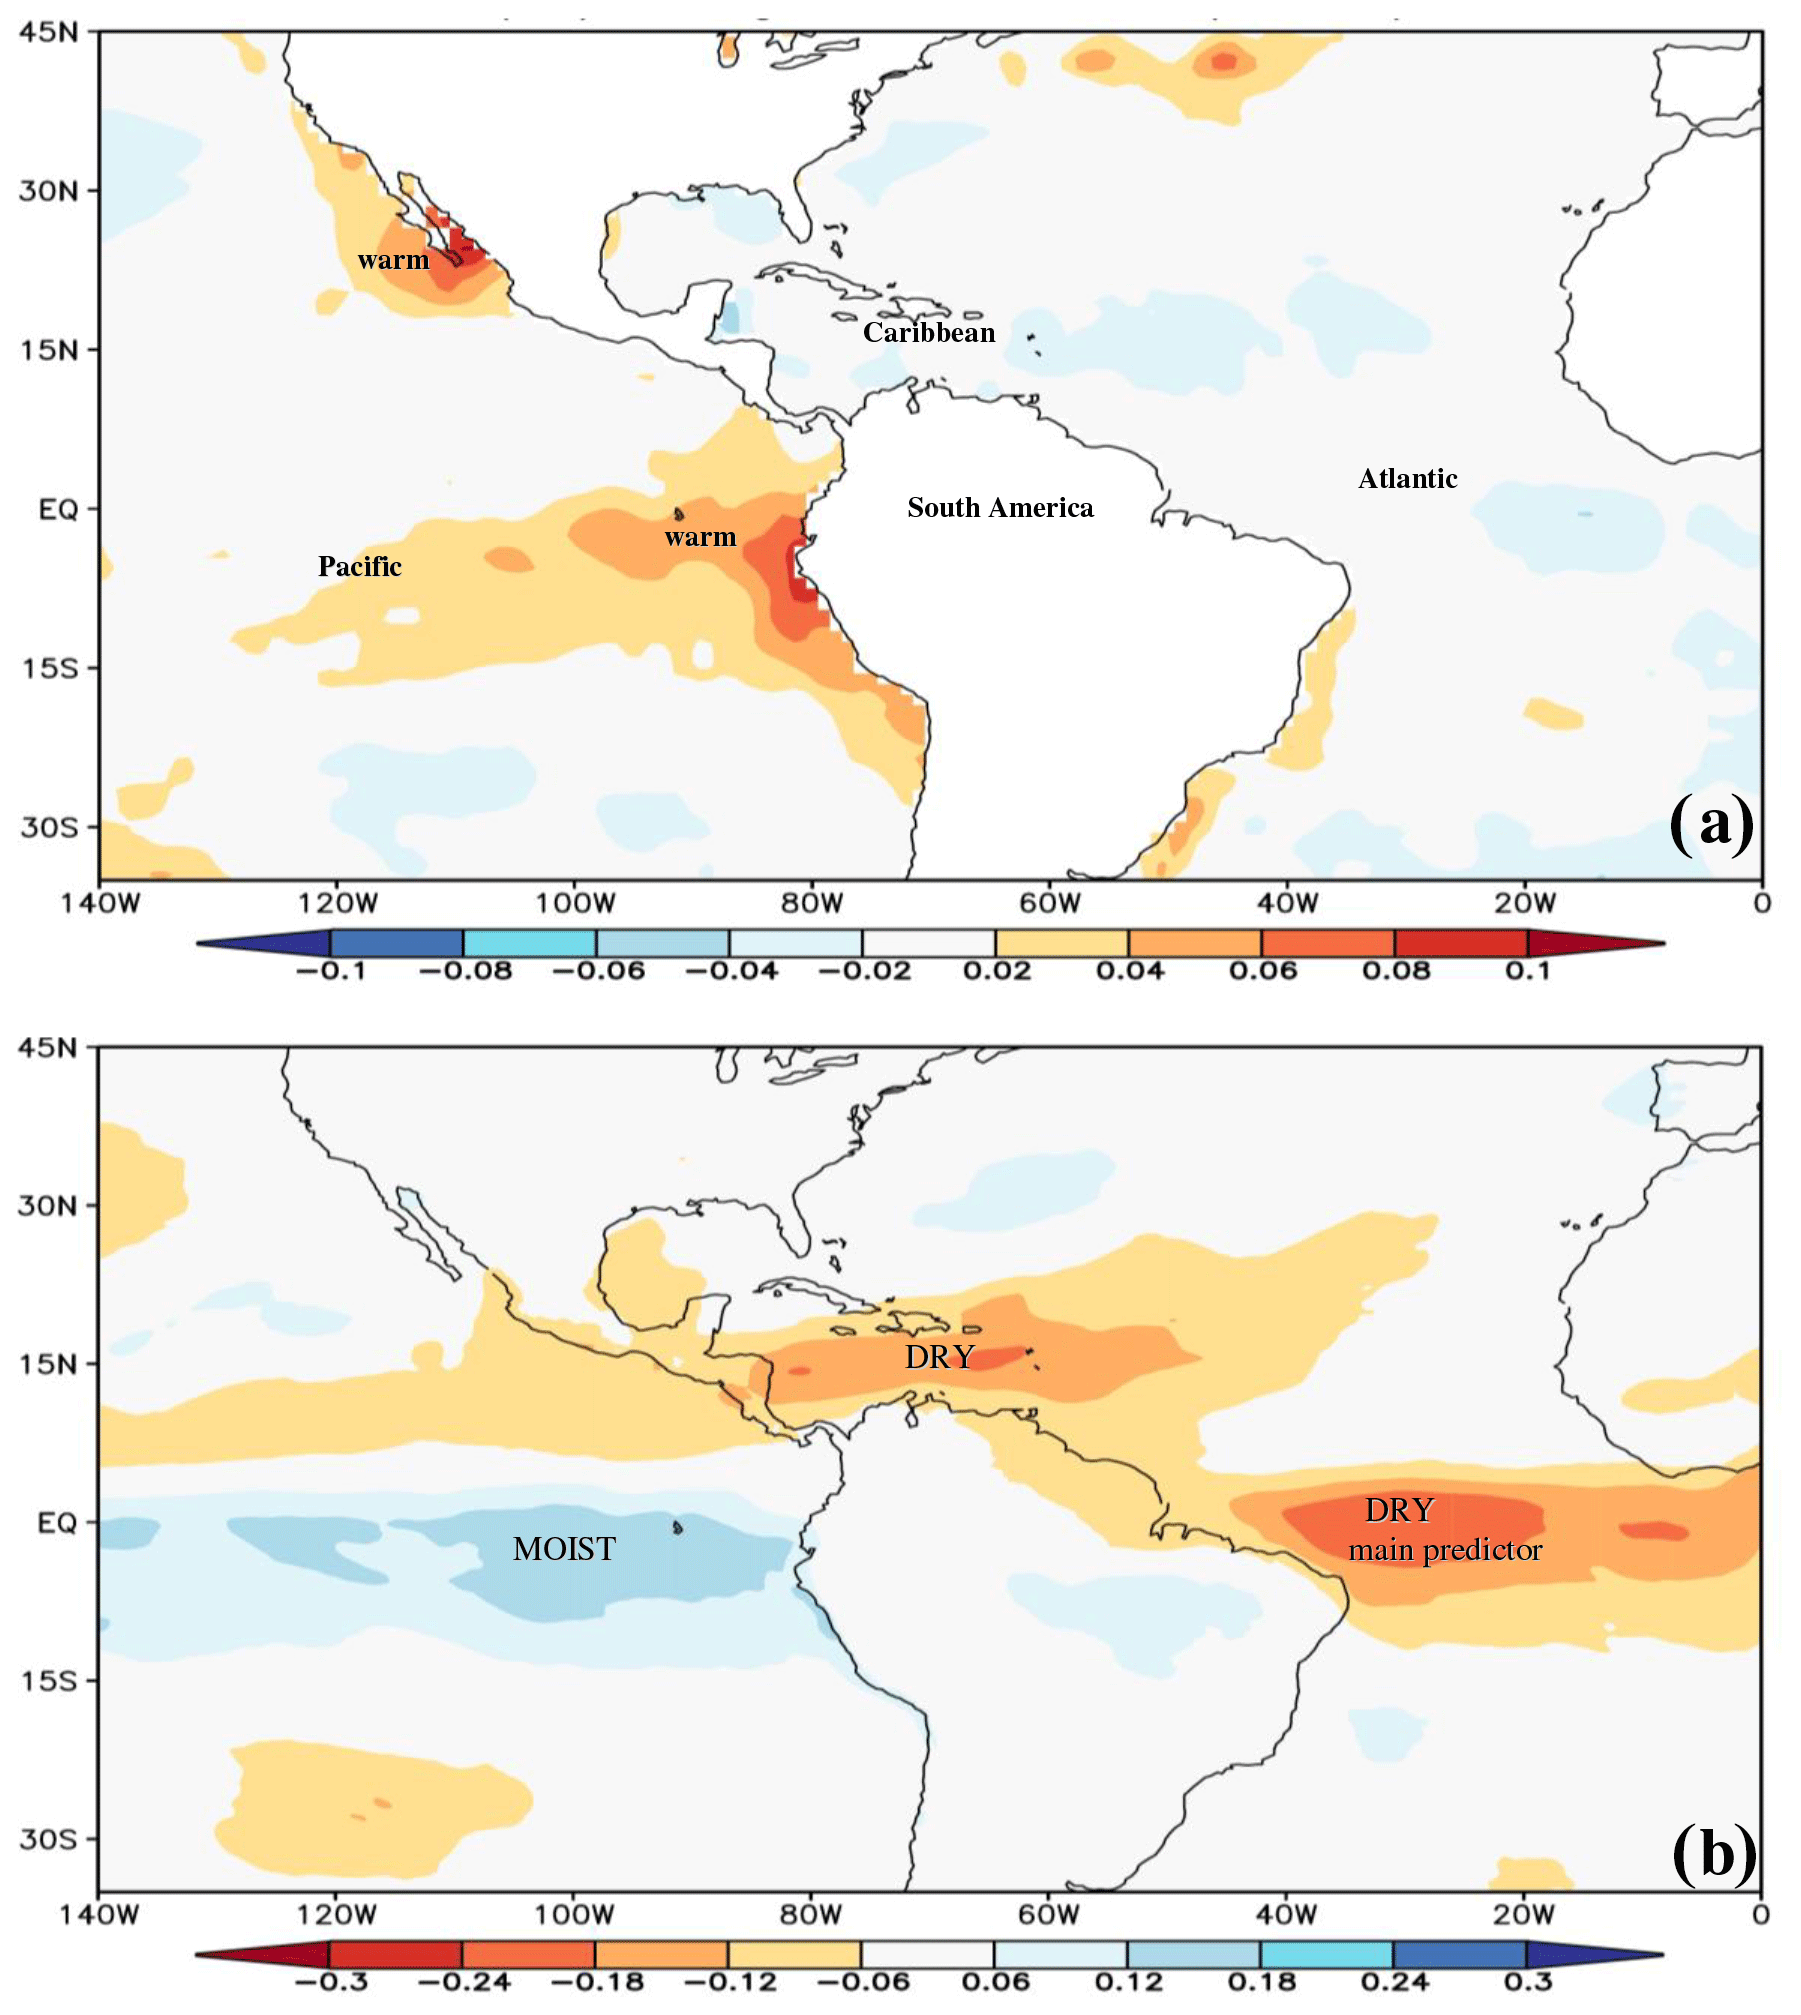
Figure 2Field regression of the Puerto Rico GDP growth rate time series on (a) sea surface temperature (°C) and (b) precipitable water (mm) in the preceding year. Geography and key features are labeled.
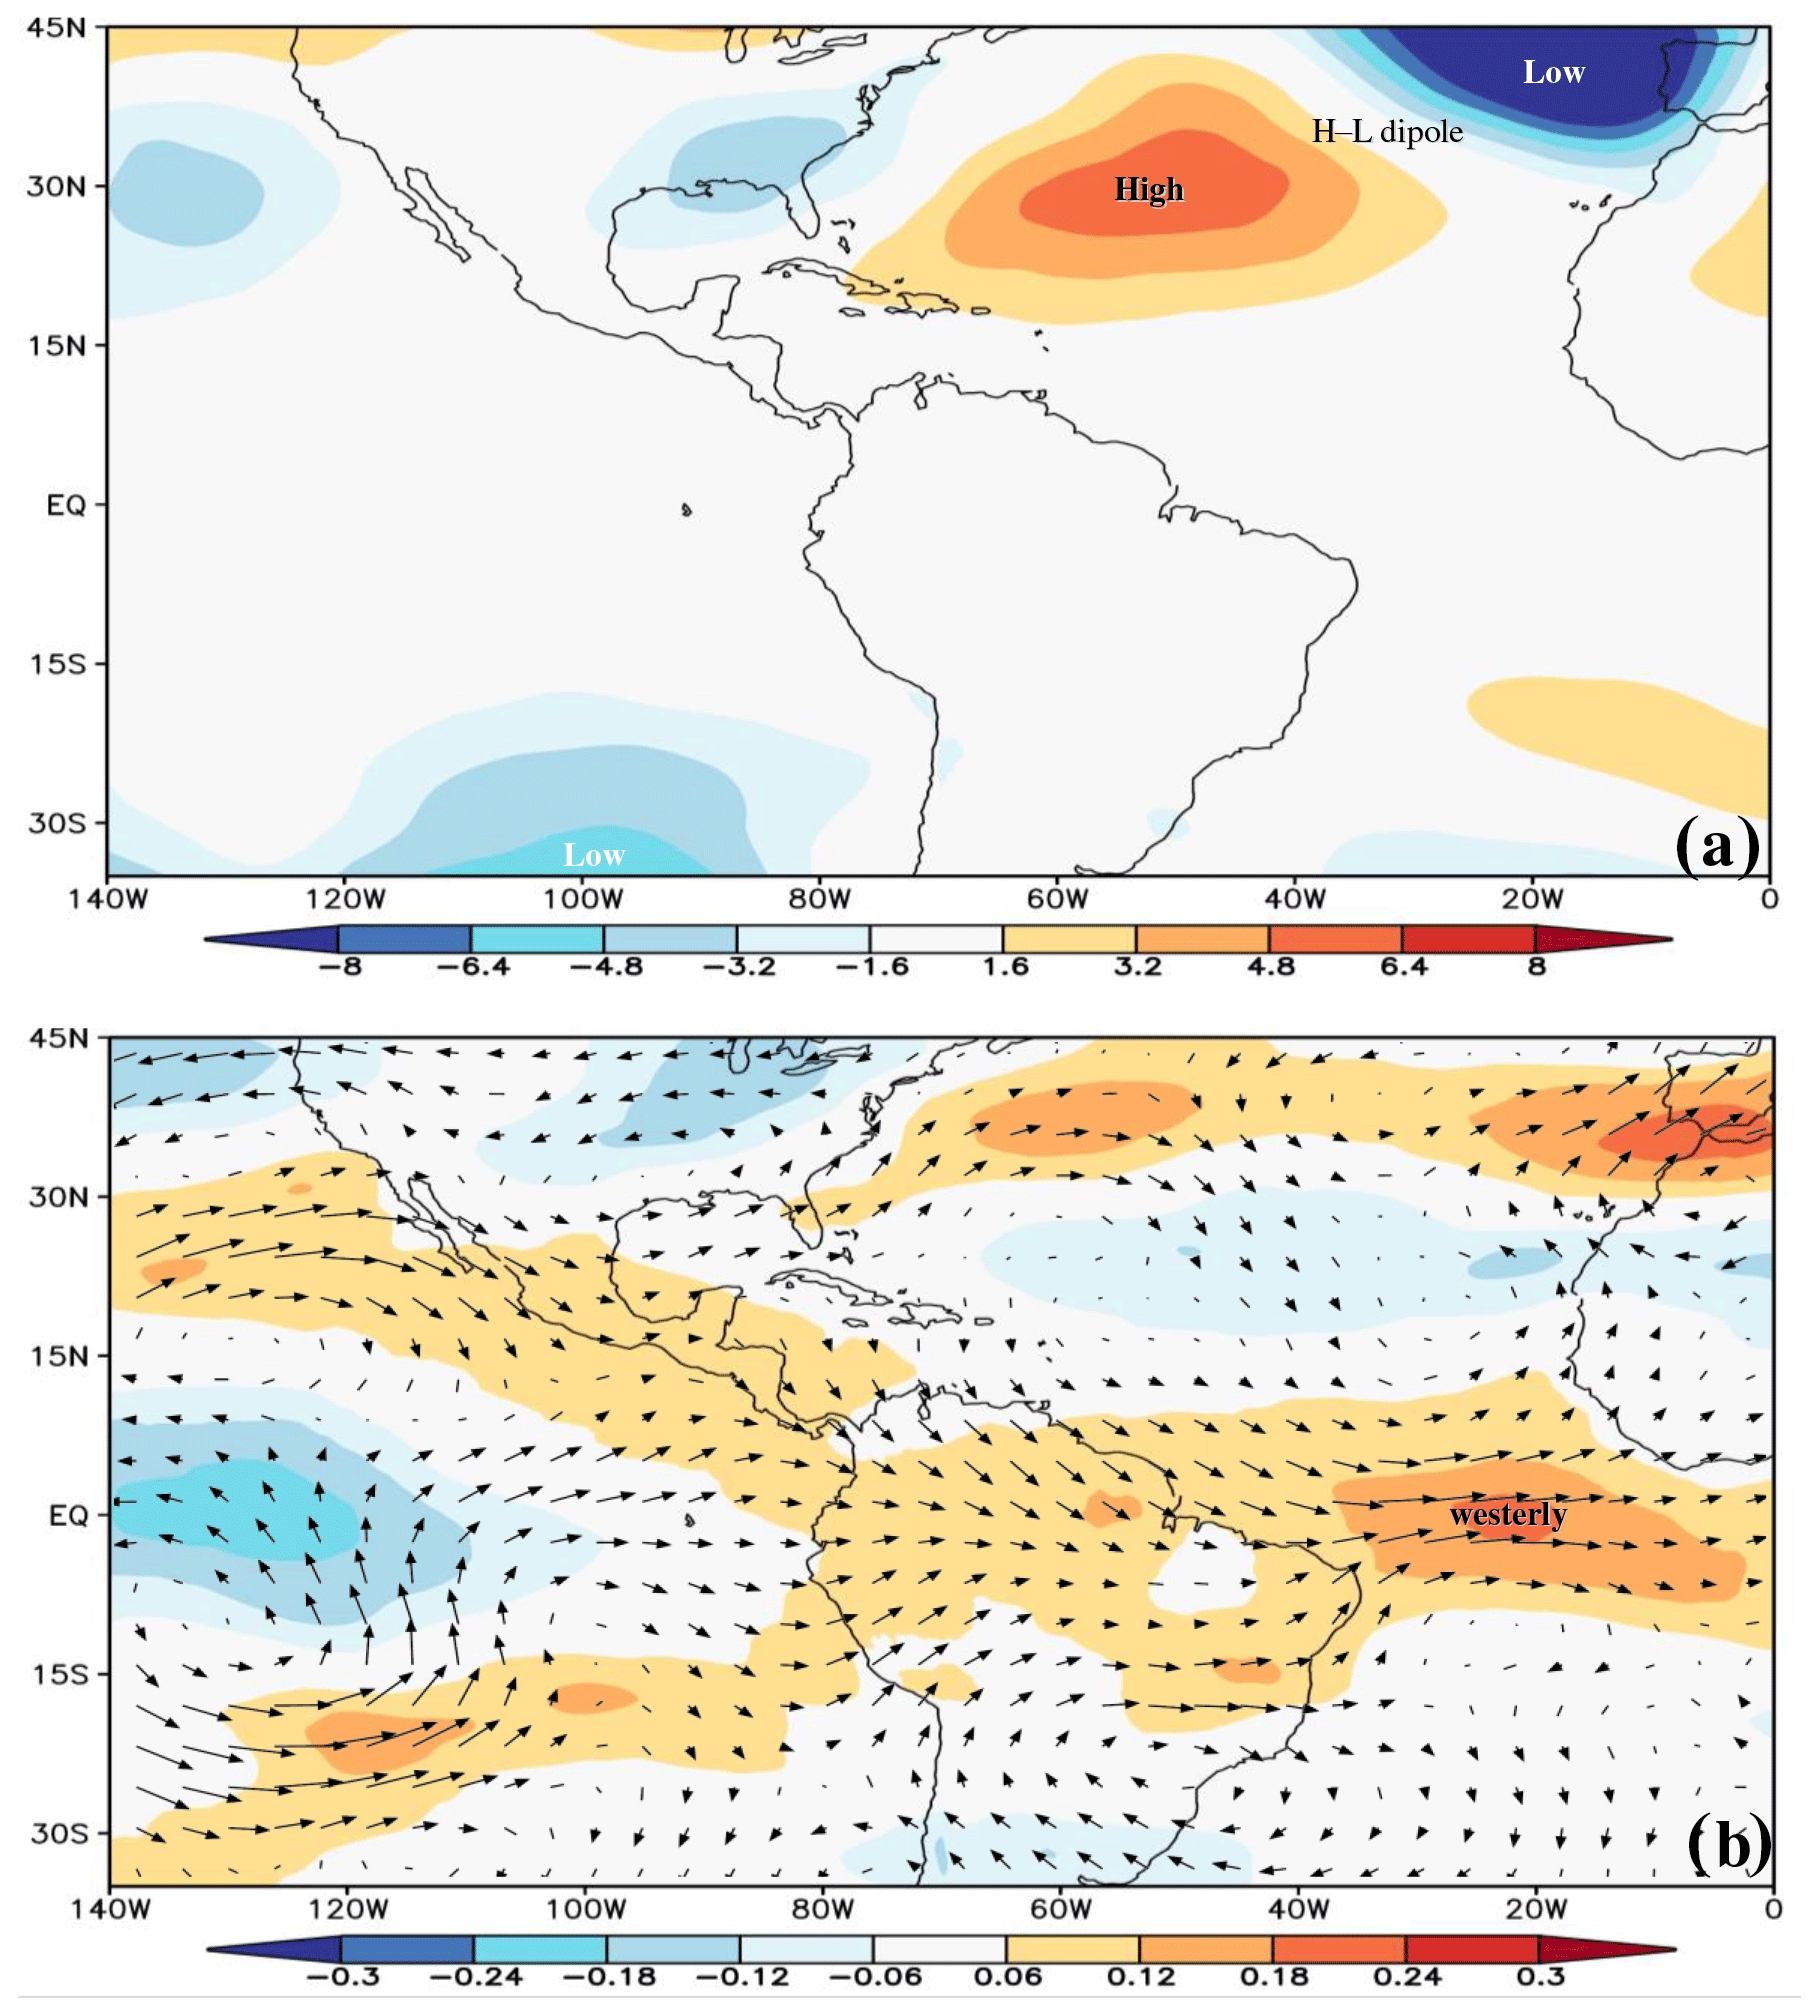
Figure 3Field regression of the Puerto Rico GDP growth rate time series on (a) geopotential height at 700 hPa (m) with icons and (b) zonal wind at 200 hPa (m s−1) in the preceding year. The composite positive-minus-negative upper-wind vectors are overlaid in panel (b).
3.2 Field regressions and composites
Regressing the Puerto Rico GDP growth rate time series onto field data in the preceding year yielded many useful insights. For SST (Fig. 2a), an eastern Pacific El Niño anticipates positive economic growth, and there was a minor signal near Baja. Both zones have subtropical wind-driven upwelling that weakens during the warm-phase ENSO. The SST off Peru (15° S–5° N, 70–100° W) reached +0.1 °C per unit of the Puerto Rico GDP growth rate in the following year. Across the subtropical Atlantic, there was an insignificant cool SST signal. However the regression with precipitable water (Fig. 2b) revealed pronounced drying of −0.3 mm per unit of GDP, in a spatial pattern that extended across the Caribbean and equatorial Atlantic (5° S–5° N, 20–40° W). The equatorial Pacific exhibited moistening with respect to the growth rate. For geopotential height at 700 hPa (Fig. 3a) a high–low dipole in the northeast Atlantic favored economic growth in Puerto Rico 1 year later. A stronger Bermuda anticyclone naturally accelerated trade winds in the Caribbean, but the low pressure west of Spain contained a stronger signal. Upper zonal winds (Fig. 3b) exhibited positive (200 hPa westerly) correlations that converged over the equatorial Atlantic, supported by composite positive-minus-negative wind vectors. In the middle Pacific, there was a negative (200 hPa easterly) correlation that reflects Walker cell divergence associated with El Niño.
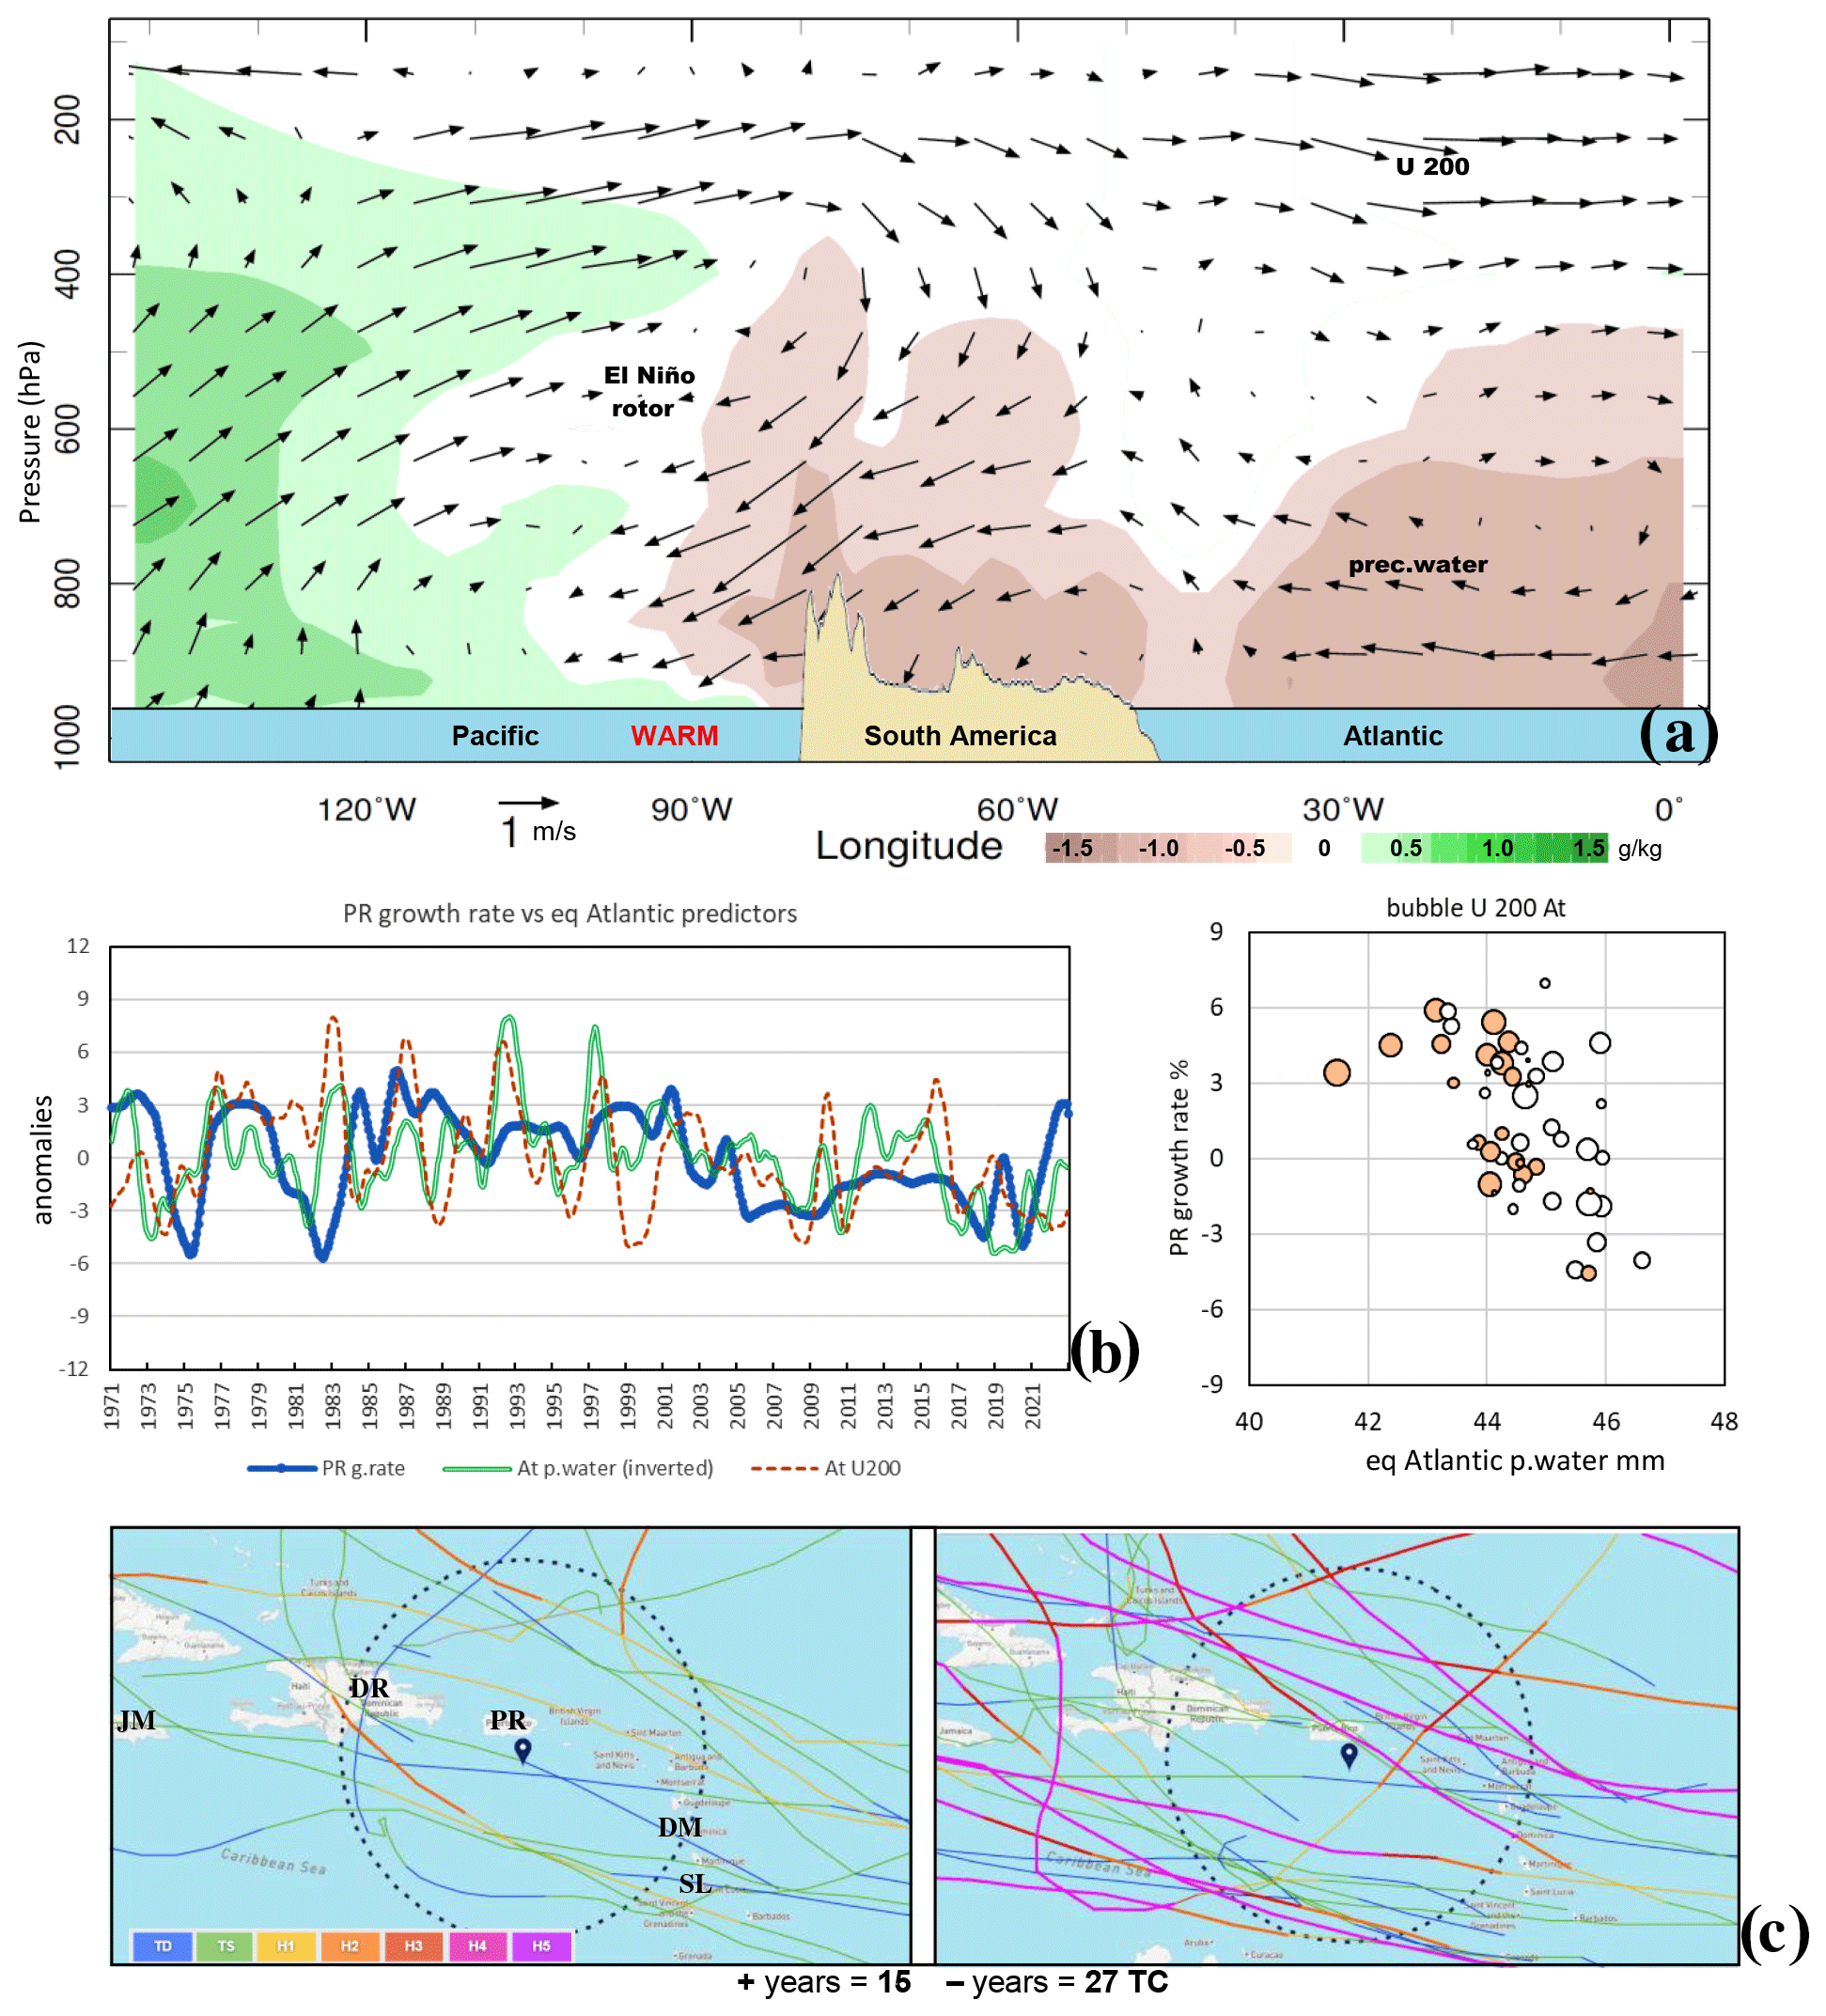
Figure 4(a) Composite positive-minus-negative precursor years on the equatorial height section of zonal circulation (vectors), specific humidity (shaded) and land–sea distribution, with features and predictors labeled. (b) The left panel shows filtered time series of the Puerto Rico growth rate and Atlantic predictors, while the right panel presents a scatterplot of the annual Puerto Rico growth rate vs. the preceding year predictors (bubble size, U200; shaded, +; open, −). (c) TC tracks before composite positive (left) and negative (right) years, showing colors for intensity, country abbreviations (left) and the target area (dashed circle).
The composite equatorial height section preceding economic growth illustrates a zonal overturning atmospheric circulation (Fig. 4a). Rising motions and moist conditions occupy the Pacific sector, while reduced humidity and lower easterly/upper westerly winds spread across South America and the Atlantic sector. The El Niño rotor subsides over Venezuela–Colombia. Positive-minus-negative composites point to environmental conditions (dry and wind shear) known to suppress transient easterly waves in late summer.
3.3 Predictor statistics and the multivariate algorithm
Table 1c lists the pairwise cross-correlation values for leading predictors with respect to the economic growth rate. Unexpectedly, coefficients for remote teleconnections exceed local impact proxies. The Peru SST correlation is weak with respect to both the combined and Puerto Rico GDP time series, and many predictors exhibit trivial values with the combined-Antilles metric. However the Puerto Rico growth rate was significantly correlated with many Atlantic predictors (r=0.24 to 0.29), reaching for precipitable water. The filtered time series and scatterplot of predictors from the equatorial Atlantic (Fig. 4b) reveal a favorable dispersion with respect to GDP change in the following year.
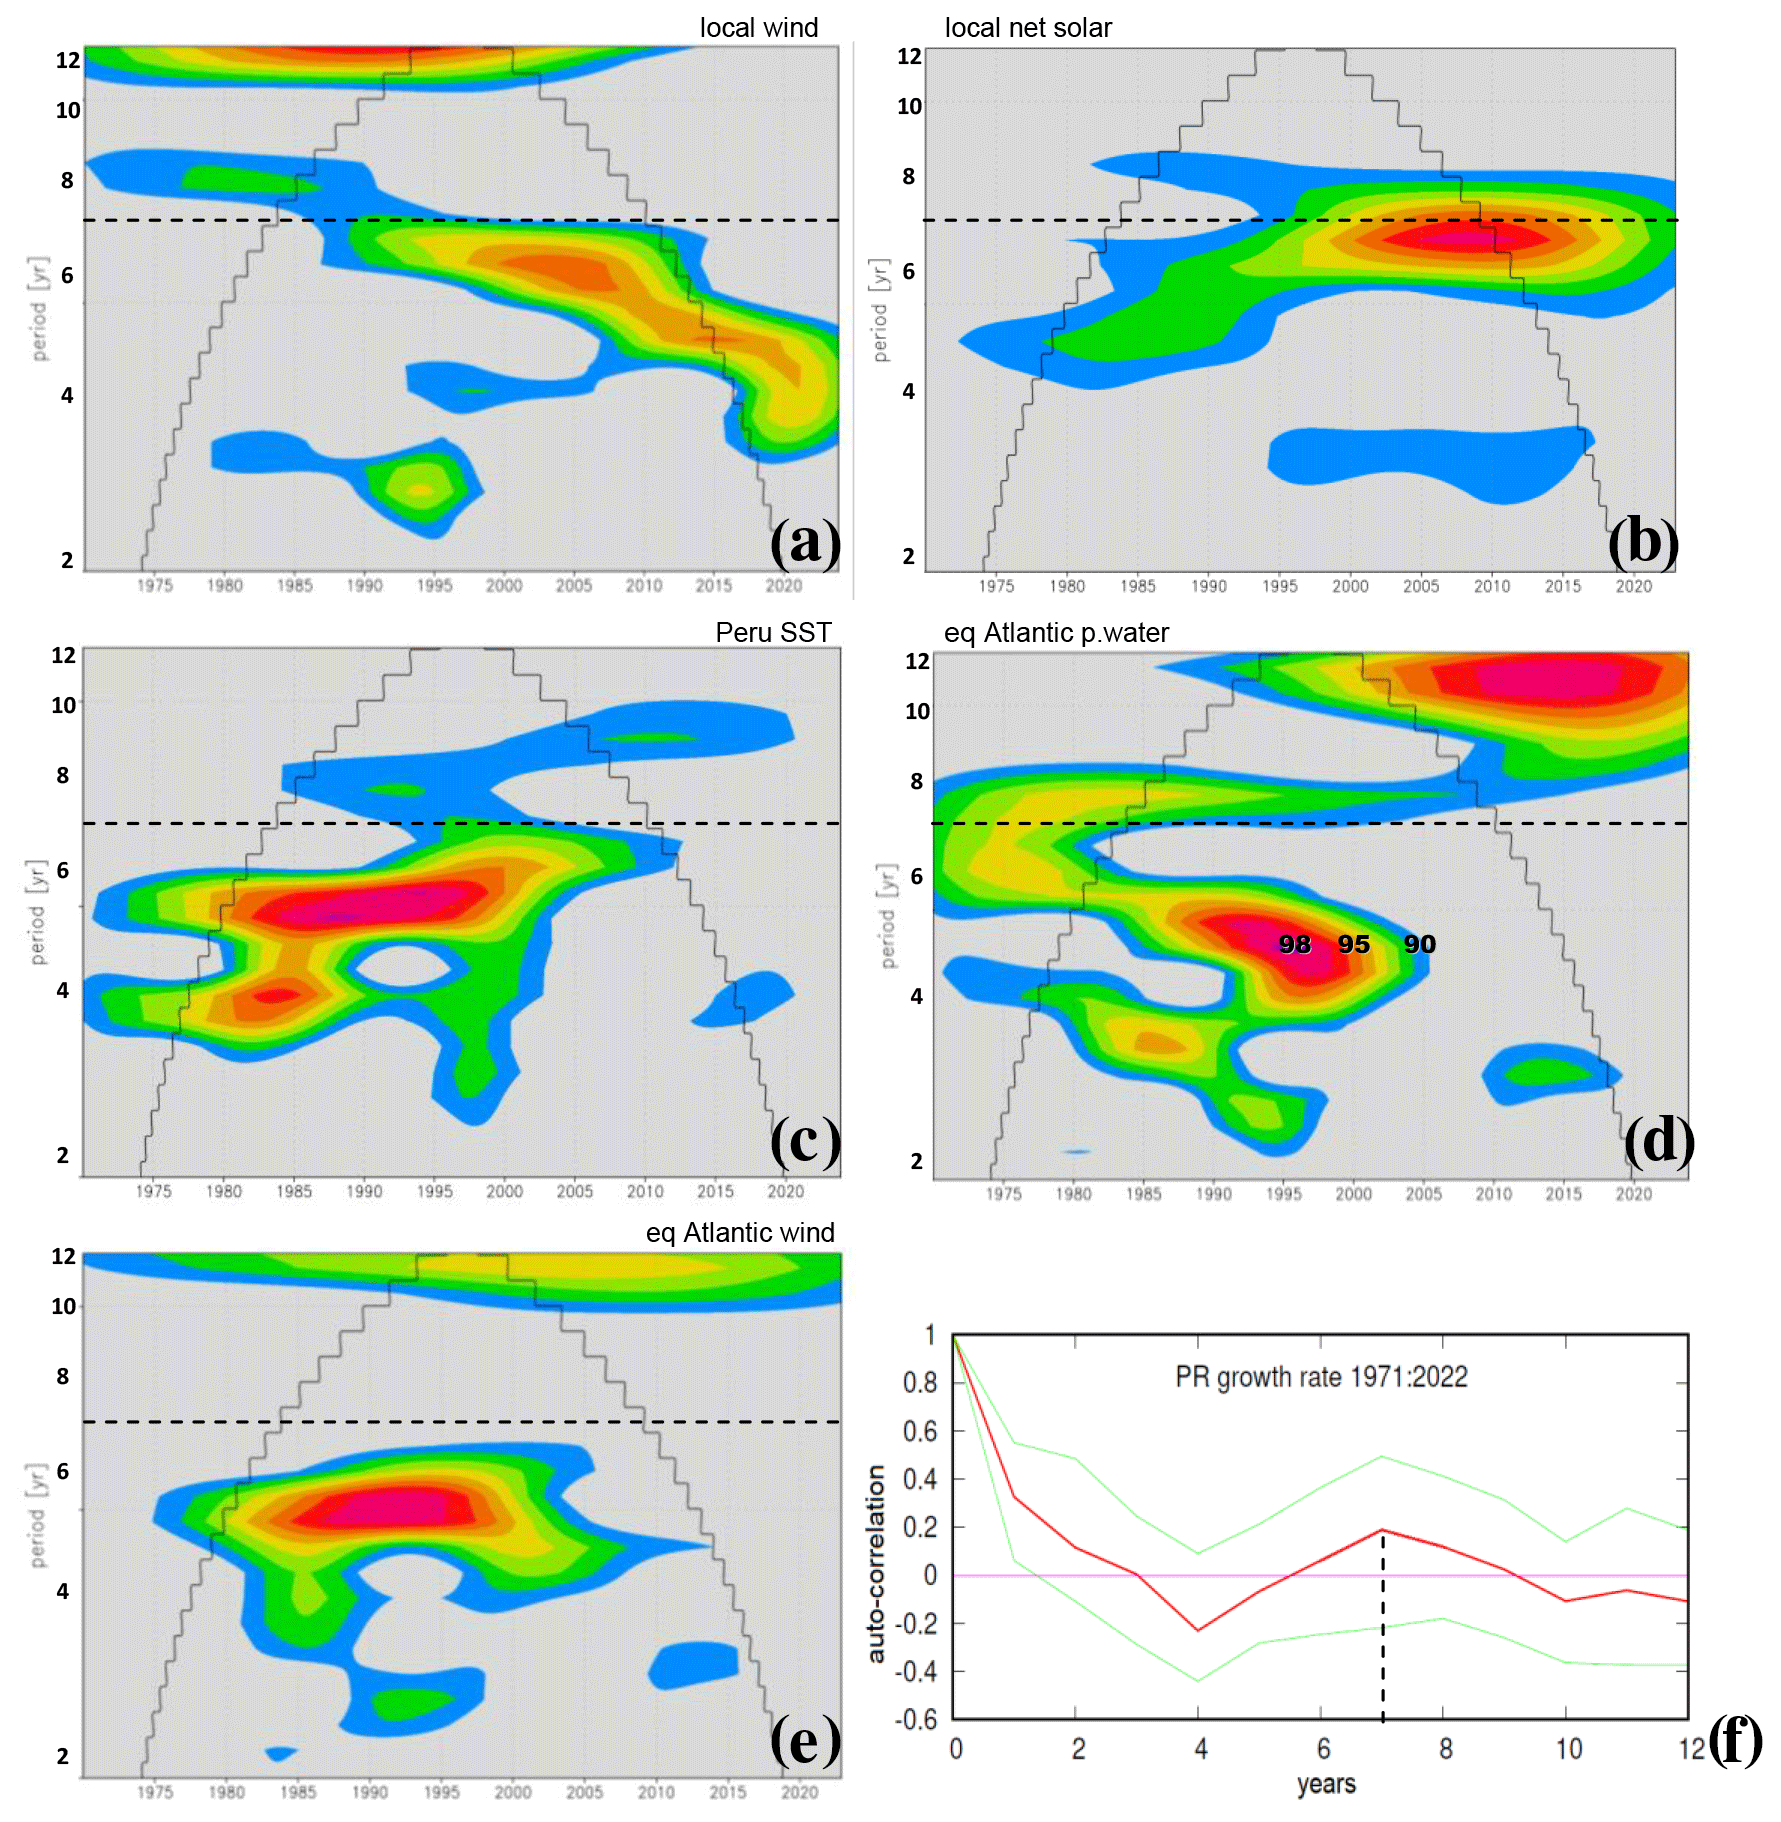
Figure 5Wavelet spectral analysis of local-impact and remote-predictor time series filtered to retain cycles >18 months: (a) maximum wind, (b) net solar radiation, (c) Peru SST, (d) eq. Atlantic p.water and (e) eq. Atlantic U 200 wind. All panels are shaded above 90 % confidence with a cone of validity and log-scale period. (f) Puerto Rico growth rate temporal lag autocorrelation, indicating a 1-year persistence and a 7-year cycle (shown using a dashed line throughout).
Table 2Multivariate regression statistics to predict the Puerto Rico GDP growth rate from the preceding year's environmental conditions.

The abbreviations used to present the statistics in the table are as follows: SE– standard error; df – degrees of freedom; SS – sum of squares; MS – mean square.
Table 2 lists the statistics following stepwise multivariate regression. The r2 is 0.31 (adjusted for degrees of freedom – df), and the equatorial Atlantic precipitable water claims a large influence (p value of 0.02). Three other predictors (Z700 dipole, U200 wind and U2 Medit) offer minor contributions and have p values of 0.22, 0.25 and 0.16, respectively.
Economic trends are naturally connected to TC frequency and intensity (Fig. 4c). The composite track maps reveal 15 TCs before positive-growth years and 27 TCs before negative-growth years. TCs often make landfall in Puerto Rico and the neighboring Antilles islands before negative years and take a westward track (280°) across the southern Caribbean toward Jamaica. The TCs are considerably weaker before positive-growth years (2 vs. 10> category-2 storms), being starved of moisture and facing westerly wind shear. However, reacting to stormy weather does not help with forward planning, instead this research has paved the way for institutions to proactively adjust economic expectations and risk exposure.
A study of the economic growth rate across the Caribbean Antilles islands has revealed a sensitivity to climate, despite the limitations of the GDP as a metric of value-added production. Daily exceedances of wind and rainfall from passing storms were found to be negatively correlated with year-over-year changes in the GDP. The analysis of net solar radiation suggests that sunny weather is associated with prosperity. Wavelet spectral analysis uncovered an inter-decadal rhythm of 4–7 years for proxy impacts (Fig. 5a, b). Field regressions with respect to Puerto Rico's GDP time series from 1971 to 2022 revealed that eastern Pacific El Niño conditions tend to favor positive economic growth in the following year. Significant predictors included the equatorial Atlantic precipitable water and upper winds as well as the northeast Atlantic dipole in geopotential height. Composite analysis of the zonal overturning atmospheric circulation and humidity demonstrated how environmental conditions influence transient easterly waves. A 5 % increase in the GDP tends to follow a 50 % decrease in tropical cyclone (TC) frequency and intensity. The multivariate algorithm to predict changes in Puerto Rico's annual GDP growth rate yielded precipitable water in the equatorial Atlantic as a leading factor, instead of sea surface temperature (SST). Reduced moisture and upper westerly winds over the equatorial Atlantic (5° S–5° N, 20–40° W) tend to boost Caribbean economic prosperity. Some of the atmospheric indices aligned with 7-year cycles in the GDP (Fig. 5c–f), providing predictability that covers about one-third of the total economic variance.
The scope of work was limited to the climate sensitivity of the GDP growth rate and did not include the testing of threshold damage functions, attenuation bias or the downstream effect of policy choices. The statistical analysis assumed that individual economic sectors form an aggregate response to TC landfall, albeit with a seasonal phase lag and localization of impact (Bertinelli and Strobl, 2013).
Long-range forecasts are only valuable when effectively disseminated and acted upon. Predictions of the climate-sensitive GDP growth rate can be used to guide the decision-making processes (Lemos et al., 2012). Economic managers in the public and private sectors can make informed decisions on risk exposure based on key indices identified here. While neutral climate conditions suggest business-as-usual conditions, significant anomalies could require precautionary measures. Actions such as adjusting interest rates, revising supply and demand expectations that affect income and expenses, and investing in weather-resilient infrastructure through property taxes can help mitigate risks. Although treating economic climate sensitivity as linear may seem simplistic, statistical outcomes can be used to anticipate positive or negative growth and help minimize volatility. Further work will analyze the individual sectoral responses and capital-city vs. rural impacts of TC landfall.

Figure A1Pie chart of the economic-sector contributions to the Puerto Rican GDP, according to World Bank data averaged from 2012 to 2022.
A spreadsheet is available from the author upon request. Many of the data were sourced from the KNMI Climate Explorer and the IRI Climate Library websites.
The author has declared that there are no competing interests.
Publisher's note: Copernicus Publications remains neutral with regard to jurisdictional claims made in the text, published maps, institutional affiliations, or any other geographical representation in this paper. While Copernicus Publications makes every effort to include appropriate place names, the final responsibility lies with the authors.
Support from the Puerto Rico Climate Office at the University of Puerto Rico Mayagüez and from the South African Department of Higher Education and Training via the University of Zululand is appreciated.
This paper was edited by Michael Wehner and reviewed by two anonymous referees.
Bertinelli, L. and Strobl, E.: Quantifying the local economic growth impact of hurricane strikes: an analysis from outer space for the Caribbean, J. Appl. Meteor. Climatol., 52, 1688–1697, 2013.
Carton, J. A. and Huang, B.: Warm events in the tropical Atlantic, J. Phys. Oceanogr., 24, 888–903, 1994.
Coast: Historical Hurricane Tracks, http://coast.noaa.gov/hurricanes/ (last access: 1 March 2024), 2024.
FAO stat.: Macro Indicators, http://www.fao.org/faostat/en/#data/MK (last access: 1 March 2024), 2024.
GAO: Puerto Rico: Factors Contributing to the Debt Crisis and Potential Federal Actions to Address Them, http://www.gao.gov/products/gao-18-387 (last access: 1 March 2024), 2018.
Guido, Z., Rountree, V., Greene, C., Gerlak, A., and Trotman, A.: Connecting climate information producers and users: boundary organization, knowledge networks, and information brokers at Caribbean climate outlook forums, Wea. Climate Soc., 8, 285–298, 2016.
Hersbach, H., Bell, B., Berrisford, P., Hirahara, S., Horányi, A., Muñoz‐Sabater, J., Nicolas, J., Peubey, C., Radu, R., Schepers, D., Simmons, A., Soci, C., Abdalla, S., Abellan, X., Balsamo, G., Bechtold, P., Biavati, G., Bidlot, J., Bonavita, M., De Chiara, G., Dahlgren, P., Dee, D., Diamantakis, M., Dragani, R., Flemming, J., Forbes, R., Fuentes, M., Geer, A., Haimberger, L., Healy, S., Hogan, R. J., Hólm, E., Janisková, M., Keeley, S., Laloyaux, P., Lopez, P., Lupu, C., Radnoti, G., de Rosnay, P., Rozum, I., Vamborg, F., Villaume, S., and Thépaut, J.-N.: The ERA5 global reanalysis, Q. J. Roy. Meteor. Soc., 146, 1999–2049, 2020.
Jury, M. R.: Economic impacts of climate variability in South Africa and development of resource prediction models, J. Appl. Meteor. Climatol., 41, 46–55, 2002.
Jury, M. R.: Topographically channeled ocean-atmosphere coupling in the southern Caribbean and summer climate variability, Climate Res., 92, 47–60, https://doi.org/10.3354/cr01733, 2024.
Jury, M. R. and Enfield, D. B.: Environmental patterns associated with active and inactive Caribbean hurricane seasons, J. Climate, 23, 2146–2160, 2010.
Jury, M. R. and Nieves-Jiménez, A. T.: Tropical Atlantic dust and the zonal circulation, Theor. Appl. Climatol., 143, 901–913, 2021.
Keenlyside, N. S. and Latif, M.: Understanding equatorial Atlantic interannual variability, J. Climate, 20, 131–142, 2007.
Klotzbach, P. J.: The influence of El Niño–Southern Oscillation and the Atlantic Multidecadal Oscillation on Caribbean tropical cyclone activity, J. Climate, 24, 721–731, 2011.
Lemos, M. C., Kirchhoff, C. J., and Ramprasad, V.: Narrowing the climate information usability gap, Nat. Climate Change, 2, 789–794, 2012.
Liberty: http://libertystreeteconomics.newyorkfed.org/2018/01/beginning-to-gauge-marias-effect-on-puerto-ricos-economy/ (last access: 1 March 2024), 2018.
Moodys: Maria: What Is the Impact on Industry in Puerto Rico?, http://www.rms.com/blog/2017/09/29/maria-what-is-the-impact-on-industry-in-puerto-rico (last access: 1 March 2024), 2017.
Rayner, N. A., Parker, D. E., Horton, E. B., Folland, C. K., Alexander, L. V., Rowell, D. P., Kent, E. C., and Kaplan, A.: Global analyses of sea surface temperature, sea ice, and night marine air temperature since the late nineteenth century, J. Geophys. Res., 108, 4407, https://doi.org/10.1029/2002JD002670, 2003.
Spencer, N. and Urquhart, M.: Hurricane strikes and migration: evidence from storms in central America and the Caribbean. Wea. Climate Soc., 10, 569–577, 2018.
Tokinaga, H., Richter, I., and Kosaka, Y.: ENSO influence on the Atlantic niño, revisited: multi-year versus single-year ENSO events, J. Climate, 32, 4585–4600, 2019.
Wu, X., Xu, Z., Liu, H, Guo, J., and Zhou, L.: What are the impacts of tropical cyclones on employment? An analysis based on meta-regression, Wea. Climate Soc., 11, 259–275, 2019.
Zhang, L., Wang, C., Wei-Qing, H., McPhaden, M. J., Hu, A., and Xing, W.: Emergence of the central Atlantic Niño, Sci. Adv., 9, eadi5507, https://doi.org/10.1126/sciadv.adi5507, 2023.