the Creative Commons Attribution 4.0 License.
the Creative Commons Attribution 4.0 License.
 | 02 Dec 2025
Soil moisture–temperature coupling during extreme warm conditions in 2018 in Sweden: a case study with WRF-CTSM
Øivind Hodnebrog
Yeliz A. Yilmaz
Terje K. Berntsen
Jana Sillmann
David M. Lawrence
Paul A. Dirmeyer
Soil moisture–temperature coupling (SM–T) significantly influences the frequency and amplitude of heat extremes. It describes how variations in soil moisture affect surface air temperature conditions and vice versa. This study aims to determine the spatial extent and duration of SM–T in southern and central Sweden, an area increasingly recognized as a coupling hot spot, during the extreme warm conditions between May and August 2018 (MJJA 2018). The assessment of coupling is based on a multi-correlation overlay analysis of key coupling variables: surface soil moisture, evaporative fraction, and daily maximum 2 m temperature from four different simulations of the coupled regional climate model WRF-CTSM, along with a merged gridded GLEAM-E-OBS observational–reanalysis dataset. These datasets demonstrate robust precision in representing the magnitude and variability of the key coupling variables during the MJJA 2018 compared to in situ observations, though the precise timing and duration of the coupling are challenging to reproduce at the local scale. WRF-CTSM provides a more realistic depiction of the key coupling variables and their interactions when recent CTSM advancements are incorporated. On average, across the study region and all five datasets, SM–T persisted for 22 d throughout the MJJA period. The atmospheric leg alone (involving daily evaporative fraction and maximum 2 m temperature), averaged across datasets, contributed 92 % to the regional coupling duration.
- Article
(10934 KB) - Full-text XML
-
Supplement
(16235 KB) - BibTeX
- EndNote


Given the high confidence in the increasing probability of compound hot and dry events accompanying the global mean temperature rise, as assessed by the IPCC AR6 Synthesis Report (Calvin et al., 2023), studies related to heat extremes are quickly expanding. From a physical science perspective, further research focused on understanding the underlying processes of heatwaves, including land-atmosphere (L–A) interactions, is still required (Barriopedro et al., 2023; Miralles et al., 2019), particularly on an individual event basis (Maraun et al., 2025). Here, an exceptionally warm period from May to August (MJJA) in 2018 over southern and central Sweden is chosen as a case study (Dirmeyer et al., 2021). This is due to its extensive anomalous warm and dry conditions spanning most of northern and central Europe. This prolonged heat period generated multifaceted impacts, making it a continuing topic of investigation within the research community (Bakke et al., 2020; Bastos et al., 2020; Dirmeyer et al., 2021; Hoy et al., 2020; Petch et al., 2020; Peters et al., 2020; Rousi et al., 2023; Salomón et al., 2022; Tak et al., 2024; Wilcke et al., 2020). The primary factor determining the onset of the warm period resulting in the heatwave conditions in 2018 was a sustained atmospheric blocking high-pressure system over the British Isles and the North Sea (Kueh and Lin, 2020). The pronounced effects were encountered over northern Europe, where drought persisted from late spring through autumn, spanning the entire growing and harvesting seasons and generating agricultural losses (C3S, 2024). Following the meteorological drought (precipitation deficit), the intensity of the event revealed rapid progression to agricultural drought (soil water deficit), and ultimately, to hydrological drought (reduced streamflow and groundwater storage) (Bakke et al., 2020). These series of circumstances are more common in mid-latitude regions and are all unusual in the generally moisture-abundant high latitudes (Dirmeyer et al., 2021; Koster et al., 2009). Nevertheless, the area of southern and central Sweden is increasingly seen as a L–A coupling hot spot region (Fu et al., 2024; Maraun et al., 2025; Yuan et al., 2023).
According to the Budyko framework (Fig. 1), high latitudes are considered part of the wet climate/soil moisture regime where the evaporation (or evapotranspiration, Miralles et al., 2020) is generally not driven by the wetness state of soil but by the available energy (Dirmeyer et al., 2009; Seneviratne et al., 2010). The mid-to-high latitudes can, however, experience a shift from the energy-limited to the soil moisture-limited evaporation regime at shorter periods when the enhanced warming decreases the soil moisture (SM) below the non-stationary critical SM threshold (Dirmeyer et al., 2021; Hsu and Dirmeyer, 2023b). This shift predominantly occurs during hot and dry summers, which are expected to become more common under a changing climate (Denissen et al., 2022; Hsu and Dirmeyer, 2023a, b). A key process in these L–A interactions is the soil moisture–temperature coupling (SM–T) illustrated in the uppermost part of Fig. 1. The respective illustrations refer to the effects of the 2 m temperature increase across different SM regimes. SM–T may occur when a region enters the transitional SM regime, while it is not associated with the dry and wet SM regimes (Maraun et al., 2025). In the dry regime, the soil water content is low and evaporation is minimal, so further drying does not induce an additional 2 m temperature rise. In the wet regime, the SM content is always sufficient to meet the atmospheric water demand. In the transitional regime, the initial temperature increase may result in a SM deficit that may generate a decrease in evaporation and thereby evaporative fraction, which may feed back to further 2 m temperature increase (Dirmeyer, 2011). This pathway of L–A interactions in the transitional SM regime can significantly magnify the intensity of the initial extreme temperature event (Maraun et al., 2025; Seneviratne et al., 2010). A shift from the wet to the transitional regime occurs when SM depletes and the typical positive relationship (Fig. 1, upper right) reverses, such that rising temperature leads to declining evaporation and subsequently, evaporative fraction.
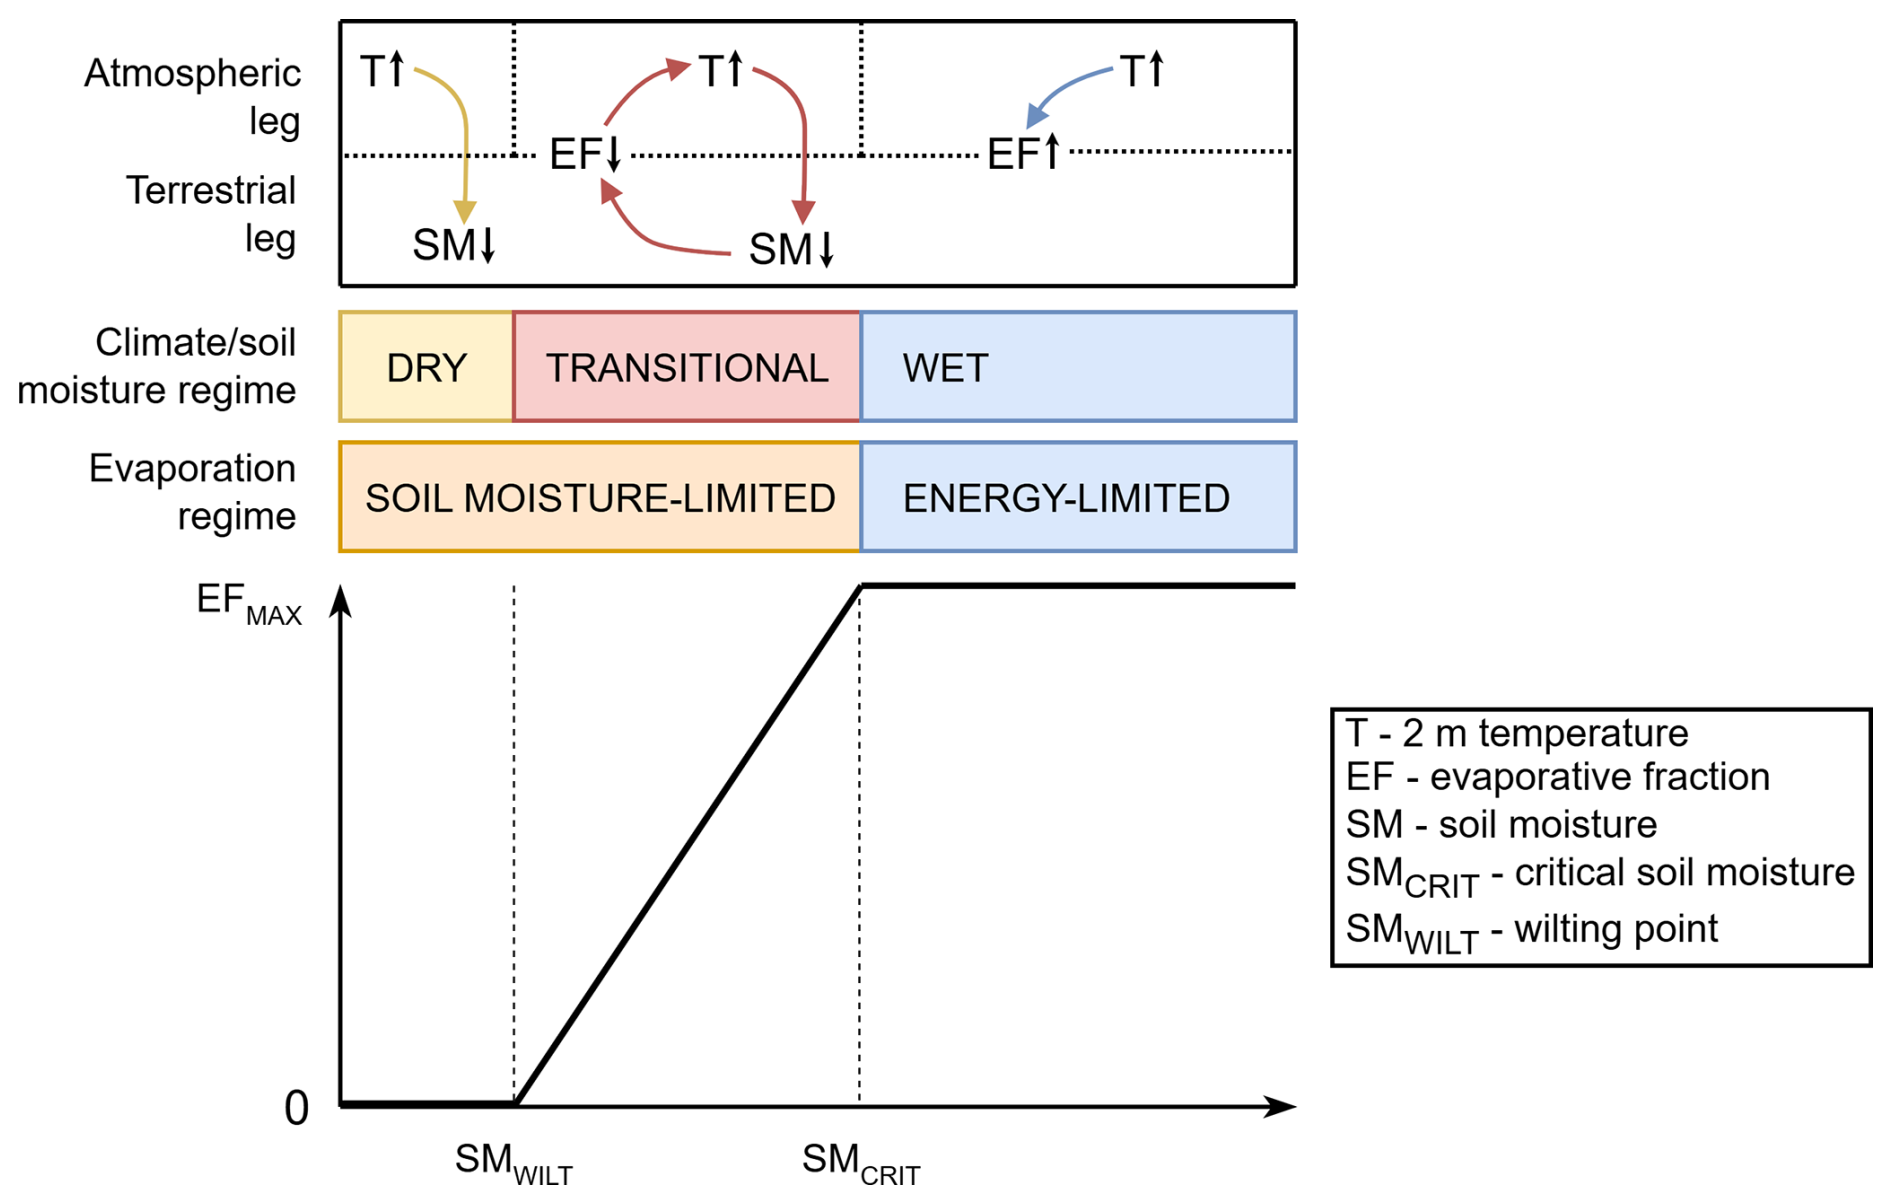
Figure 1Conceptual framework of the dependence of evaporative fraction on soil moisture in different evaporation and climate/soil moisture regimes [modified from Seneviratne et al., 2010]. The uppermost section of the figure illustrates the effects of the 2 m temperature increase across different regimes that may influence the occurrence of soil moisture–temperature coupling. Arrows indicate the direction of relationships between variables. For example, a rise in 2 m temperature leads to a decrease in soil moisture in the transitional climate/soil moisture regime.
Soil moisture–temperature interactions modify the surface energy balance, which in turn accelerates global warming in Earth System Models (Qiao et al., 2023). This underlines that the ability to represent the coupling will affect the future projections of heat extremes (Hsu and Dirmeyer, 2023b; Schwitalla et al., 2025; Zarakas et al., 2024). Our study employs the recently developed coupled regional climate model WRF-CTSM (UCAR, 2021; Mužić et al., 2025) for the extreme heat analysis. It combines the Weather Research and Forecasting model, WRF (Skamarock et al., 2021), and the Community Terrestrial Systems Model, CTSM, which at present corresponds to the Community Land Model, CLM (version CLM5) (Lawrence et al., 2019). WRF and CTSM are currently considered among the most sophisticated atmospheric and land surface models. This facilitates tackling some of the current knowledge gaps in heatwave research, indicated by Barriopedro et al. (2023) and Miralles et al. (2019). Accordingly, the two main objectives of this study are:
-
To evaluate the representation of the key variables for SM–T analysis during the warm MJJA 2018 period in a set of WRF-CTSM simulations and an additional independent gridded dataset derived from observations and reanalysis inputs (GLEAM-E-OBS).
-
To examine the spatial extent and duration of the SM–T and its components throughout the MJJA 2018 in a set of WRF-CTSM simulations and GLEAM-E-OBS.
These objectives follow the findings from the study by Dirmeyer et al. (2021), who, based on in situ and reanalysis datasets, found that SM–T amplified the strength of the drought and heatwave as part of the summer in 2018 in the same study region (i.e., southern and central Sweden). Here, four different WRF-CTSM simulations are employed to assess if the model captures the extremity of the event as well as the variability and magnitude of the key coupling variables throughout MJJA 2018; surface soil moisture (SMSURF), evaporative fraction (EF), maximum 2 m temperature (TMAX) as well as their drivers; net radiation (RNET), sensible heat (SH), latent heat (LH), and precipitation (PR). To assess the local and regional spatial extent and duration of daily SM–T and its components, model simulations are accompanied by additional datasets described in the following.
2.1 Datasets
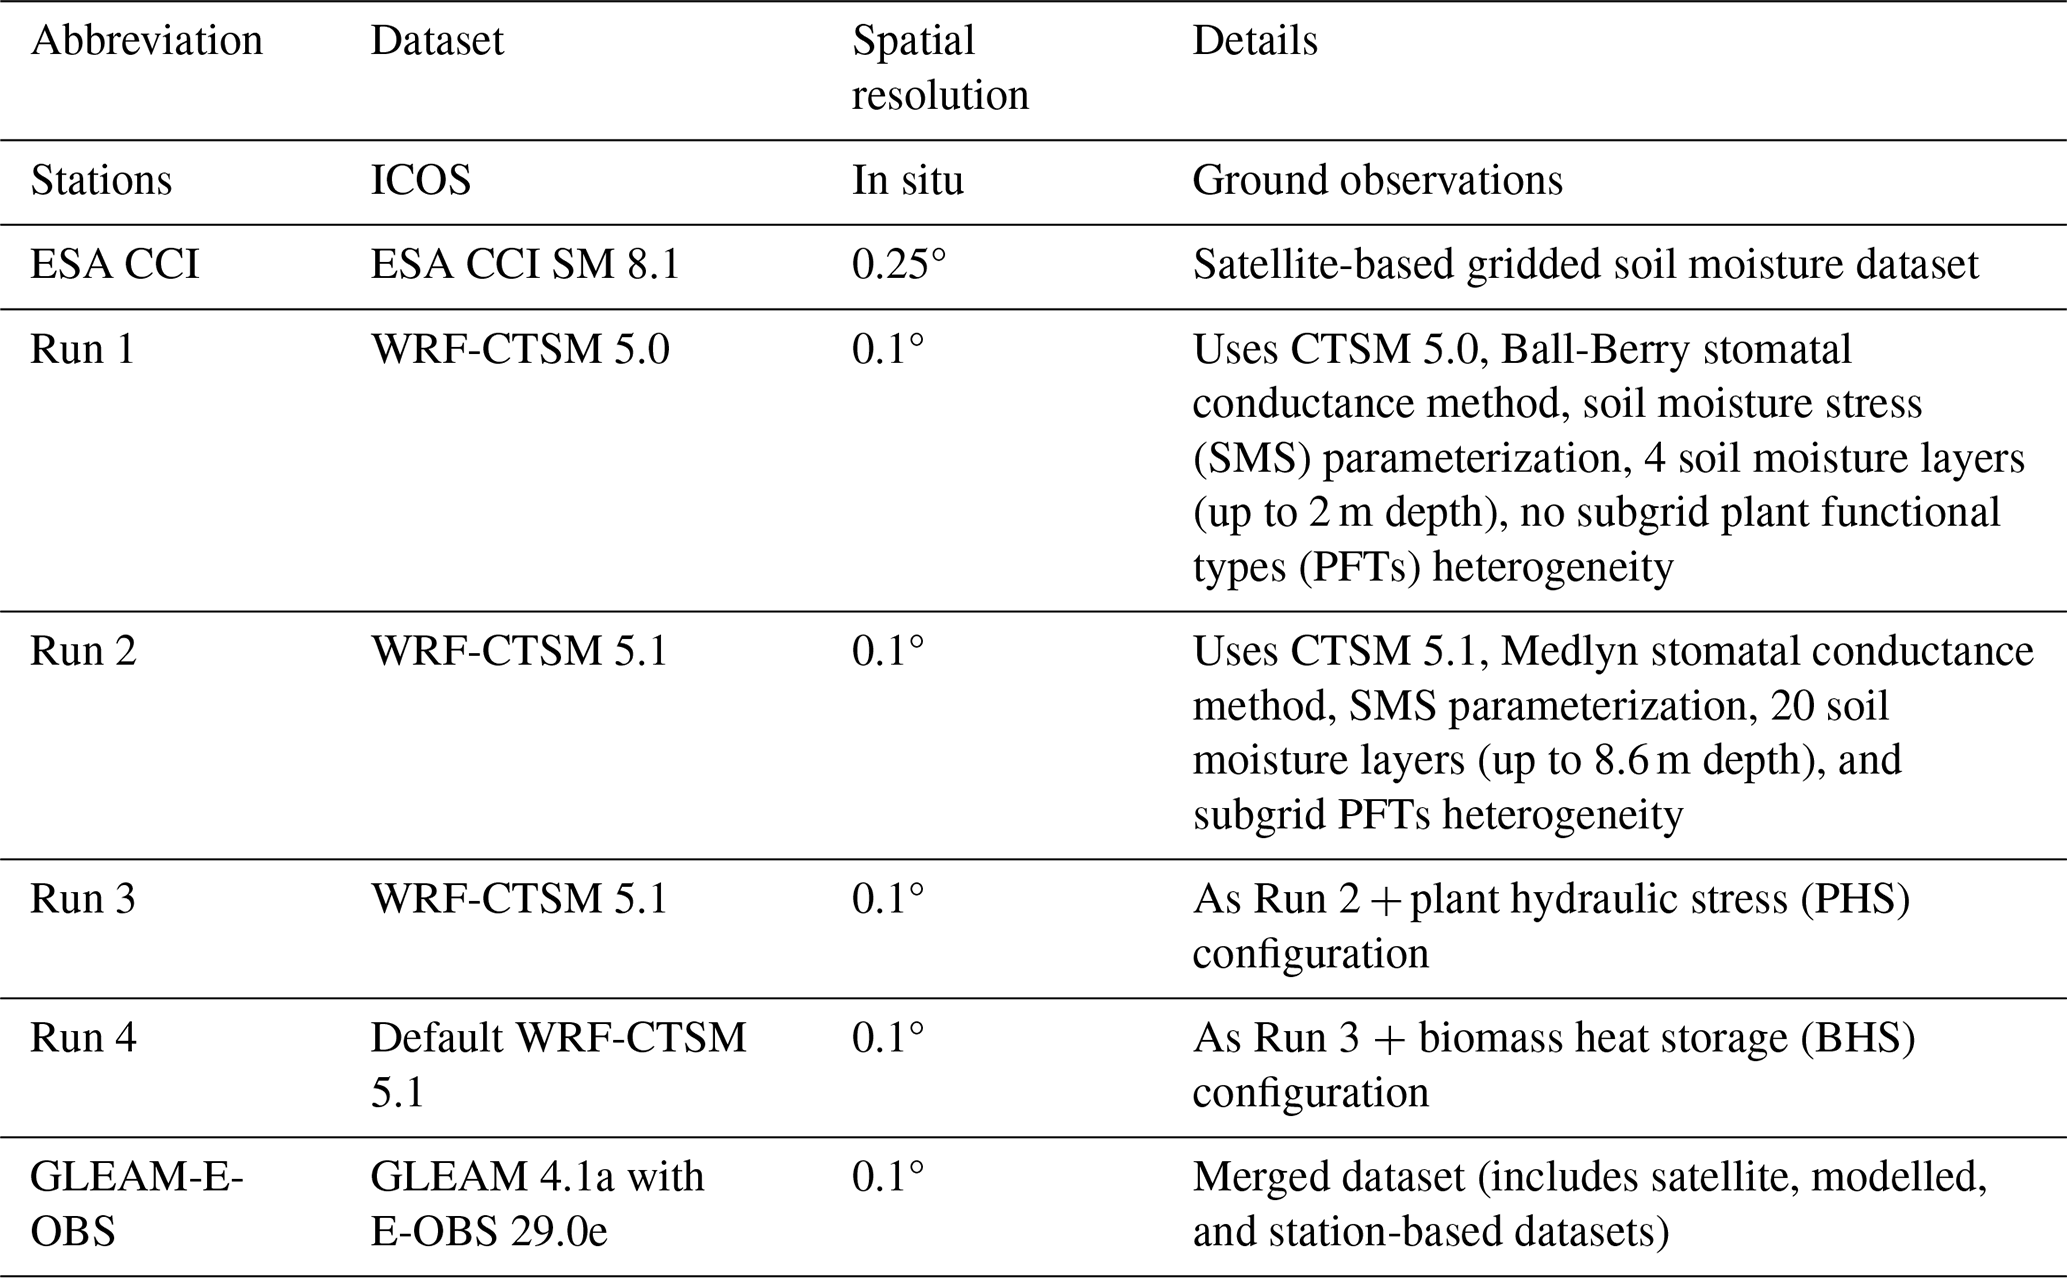
Datasets at daily time resolution used to support the SM–T analysis during the MJJA 2018 include in situ observations, a gridded satellite-based dataset (ESA CCI), four WRF-CTSM simulations, and a gridded merged observational–reanalysis dataset (GLEAM-E-OBS). For clarity, observational products and model outputs are both referred to as “datasets” throughout this study. An overview of the respective datasets is listed in Table 1 and explained in the subsequent sections.
2.1.1 Stations
ICOS ground observations from Drought 2018 Team and ICOS Ecosystem Thematic Centre (2020) (station Lanna), and from Warm Winter 2020 Team and ICOS Ecosystem Thematic Centre (2022) (stations Norunda, Hyltemossa, Rosinedal-3, and Degerö) are flux tower data products in FLUXNET2015 format (Pastorello et al., 2020). These stations provide daily data for the investigated variables: SMSURF (corresponding to 0–0.1 m soil depth), SH and LH (for the calculation of EF), TMAX, PR, and RNET. Their locations within the study area are presented in Fig. 2.
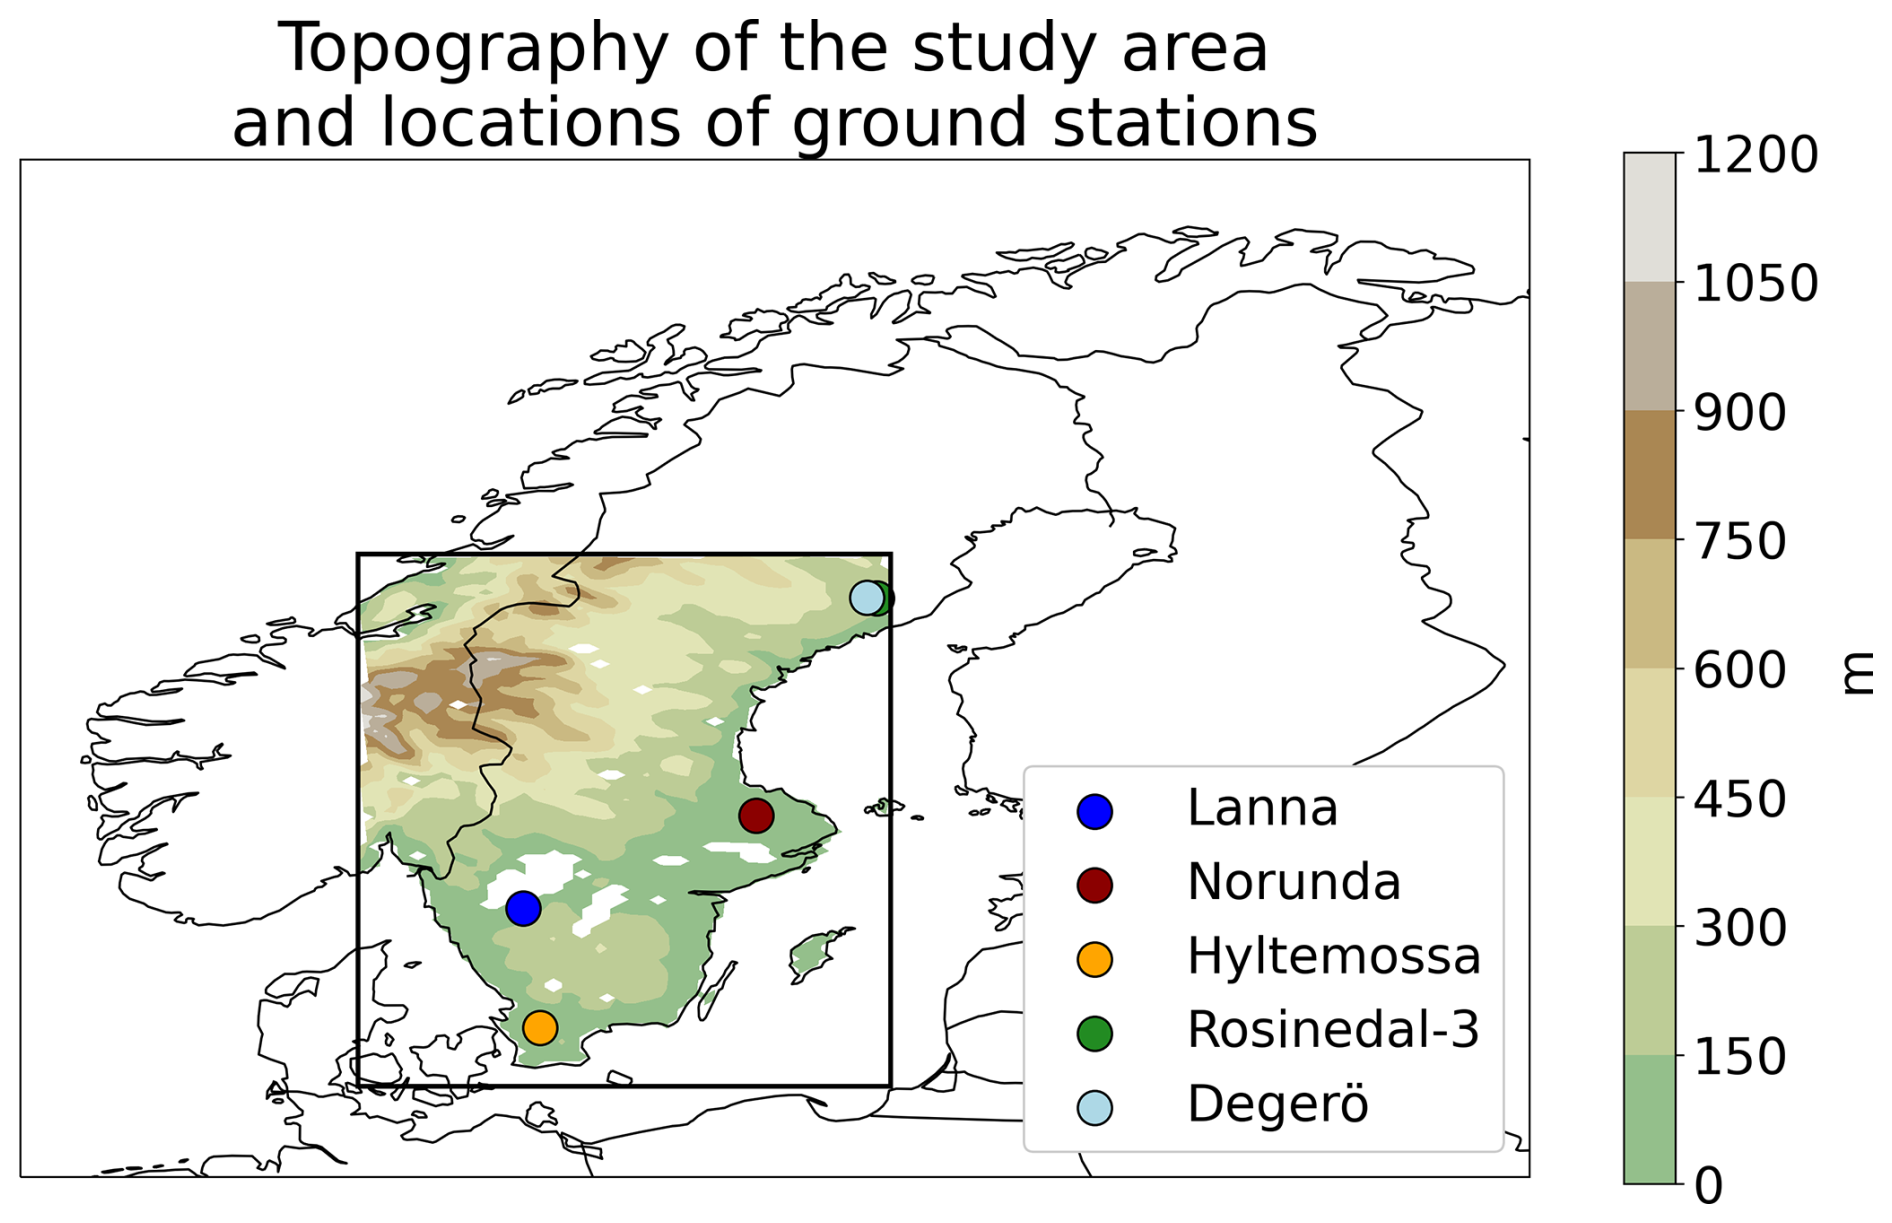
Figure 2An overview of the ground stations' locations (symbols) and the study area's elevation (shading). Lakes within the study area are denoted in white.
The study area and the selection of stations follow the methodology adopted from Dirmeyer et al. (2021). Here, three additional stations were considered (Norunda, Rosinedal-3, and Degerö), while Svartberget was omitted since the newest version of its dataset does not provide data for SMSURF. Only the best-quality station data that correspond to the directly measured values are used in the analysis. In situ observations are considered as ground truth and used as an evaluation dataset in our study.
2.1.2 ESA CCI
As indicated above, the availability of stations providing SM data in the study region is generally sparse. Additionally, the WRF-CTSM SMSURF model output is, among the variables used in this study, the only one not previously validated over Sweden (Mužić et al., 2025). Hence, the European Space Agency's Climate Change Initiative (ESA CCI) Soil Moisture (SM) product (Dorigo et al., 2017; Gruber et al., 2019; Preimesberger et al., 2021) is utilized as an additional evaluation dataset for the assessment of the regional-scale WRF-CTSM performance in simulating SMSURF. It is a daily global satellite SMSURF dataset available at 0.25° spatial resolution. The ESA CCI COMBINED product used in this study is derived from a range of active and passive satellite remote-sensing instruments measuring SMSURF (the corresponding soil depth layer is 0–0.05 m) in the microwave range (Preimesberger et al., 2021). Here, only good-quality (no inconsistency flagged) data are selected, so all unreliable data points are masked out.
2.1.3 Model simulations
A set of four WRF-CTSM simulations for the year 2018 on 10.5 km horizontal resolution is performed over a domain covering Norway, Sweden, and Finland, shown in Fig. 2; the rectangle indicates the analysis region of southern and central Sweden. Employing four WRF-CTSM simulations generates more robust findings and provides insight into the role of model advancements over time for the SM–T assessment. All four WRF-CTSM simulations are based on the initial and boundary conditions from ERA5 (Hersbach et al., 2020), while the spectral nudging of temperature, horizontal winds, and humidity is performed above the planetary boundary layer (PBL). WRF parameterization schemes used are the Rapid Radiative Transfer Model for General Circulation Models (RRTMG) radiation scheme (Iacono et al., 2008), Kain-Fritsch (KF) convection scheme (Kain, 2004), WRF Single-Moment 6-class Microphysics Scheme (WSM6) (Hong and Lim, 2006), and the Yonsei University Scheme (YSU) PBL scheme (Hong et al., 2006). The leaf area index (LAI) is prescribed by the “satellite phenology” option in CTSM. Alongside the respective common settings, the main differences among the four simulations are summarized in Table 1 and described below.
Run 1 is considered a reference simulation since it follows the setup used in the WRF-CTSM evaluation study by Mužić et al. (2025). It includes a long simulation period between 2010 and 2022. The subsequent simulations (Runs 2–4) simulate only the year 2018 using a 2-year spin-up starting from 1 January 2016, of Run 1. Runs 2–4 use configurations with recent CTSM advancements (Lawrence et al., 2019), namely, a newer CTSM model version (including physics and parameterizations), the stomatal conductance method by Medlyn et al. (2011), 20 (non-bedrock hydrologically and biogeochemically active) soil layers spanning up to 8.6 m depth, and subgrid heterogeneity of plant functional types (PFTs). Run 3 additionally includes the plant hydraulic stress configuration (PHS) suitable for heatwave research, developed by Kennedy et al. (2019). Finally, Run 4 also incorporates the biomass heat storage configuration (BHS) introduced by Meier et al. (2019). Hence, Run 4 uses WRF coupled with CTSM 5.1 in its current default configuration. This way, the simulations' numbering order (Runs 1–4) follows the CTSM advancements tailored for improved representation of the land surface water and energy exchange.
2.1.4 GLEAM-E-OBS
Global Land Evaporation Amsterdam Model (GLEAM) (Hulsman et al., 2023; Koppa et al., 2022; Miralles et al., 2011, 2025; Zhong et al., 2022) and E-OBS (Cornes et al., 2018) datasets are in our study merged to supplement the WRF-CTSM MJJA 2018 analysis results with an independent gridded dataset originally provided at the analogous spatial resolution as the model output (0.1°). As it is a merged observational–reanalysis dataset, it is not considered as ground truth and is evaluated the same way as the WRF-CTSM simulations by benchmarking against in situ observations.
GLEAM 4.1a is a recently issued global dataset of surface water exchange variables on a 0.1° grid and with a daily temporal resolution (Miralles et al., 2025). It is based on satellite and reanalysis data and is included in this analysis as this version for the first time also provides SH, which is needed to calculate the EF. GLEAM variables employed in this study as part of the GLEAM-E-OBS dataset are the SMSURF (soil depth layer corresponding to 0–0.1 m depth), actual evaporation (includes transpiration, bare soil evaporation, open water evaporation, interception loss, and snow sublimation), and SH. GLEAM 4.1a utilizes SMSURF input data from the ESA CCI COMBINED 8.1 dataset.
E-OBS is a gridded observational dataset on 0.1° resolution over Europe produced based on the network of the European Climate Assessment and Data (ECA&D) stations (Cornes et al., 2018). E-OBS variables used in the blended GLEAM-E-OBS dataset include daily TMAX and daily total PR.
2.1.5 Datasets integration
Gridded datasets from Table 1 are compared to the station data by selecting the nearest grid cells to each station and masking their data to reflect the temporal coverage of the respective stations. ESA CCI and GLEAM-E-OBS datasets are regridded to the spatial resolution and coordinate system of WRF-CTSM using bilinear interpolation. Spatio-temporal gaps in GLEAM-E-OBS are primarily associated with the discontinuities in the GLEAM SMSURF variable as a result of different satellite passing cycles, complex topography, surface water, dense vegetation, urban structures, and frozen and snow-covered soil conditions (Dorigo et al., 2017). These gaps are masked from the rest of the GLEAM-E-OBS variables to ensure a consistent dataset. Furthermore, lake grid cells are masked from all datasets. The equations used for the unit conversions of SMSURF and LH among datasets are given in Sect. S1. The evaluation metrics for comparing WRF-CTSM simulations and GLEAM-E-OBS with in situ observations and ESA CCI are the Pearson correlation coefficient (PCC), root mean square error (RMSE), and absolute bias (AB) described in Sect. S2.
2.2 Methods
The assessment of SM–T is in our study based on the two-legged coupling metric (Dirmeyer, 2011) with adjustments to facilitate the quantification of the coupling duration and the role of the coupling components throughout the exceptionally warm MJJA 2018 period. The approach consists of a correlation coefficient analysis (Dirmeyer et al., 2009) among daily SMSURF, EF, and TMAX. EF represents the ratio of LH to the available energy and is calculated as:
where EF is the evaporative fraction, and LH and SH are latent and sensible heat (W m−2), respectively (Shuttleworth et al., 1989).
The soil moisture–temperature coupling diagnostic is in our study defined as:
where SMSURF is surface soil moisture, EF is evaporative fraction, TMAX is daily maximum temperature, t is time, and r is the Pearson correlation coefficient.
This definition (Eq. 2) employs variables used in the SM–T coupling assessment by Schwingshackl et al. (2017). Here, SM–T is broken down and assessed according to three coupling components: TMAX:SMSURF, SMSURF:EF (terrestrial leg), and EF:TMAX (atmospheric leg). Accordingly, the analysis includes three daily time series (one for each of the three coupling components) of the PCCs obtained from periods corresponding to a 92 d running window centered on the day in question. The respective running windows for the first and last 92 d of the MJJA period include days before May and after August. SM–T is considered present only in areas that simultaneously exhibit a positive TMAX trend over the 92 d running window and a combination of correlations within the same window: negative TMAX:SMSURF, positive SMSURF:EF, and negative EF:TMAX. This combination is referred to as a complete coupling (Eq. 2). Selecting 92 d provides a robust statistic while not smoothing out the variability throughout the MJJA period (Findell et al., 2015). Building on the framework of Rousi et al. (2023), who examined SM:LH using 92 d running periods, this multi-correlation overlay approach serves as an alternative to the piecewise/segmented regression method used by, e.g., Dirmeyer et al. (2021), Schwingshackl et al. (2017), Ukkola et al. (2018), Tak et al. (2024), and Fu et al. (2024). Both methodologies indicate the direction and magnitude of the coupling, but the advantage of the multi-correlation overlay approach is that it does not rely on critical SM values. The critical SM is not stationary as the wilting point; it varies in magnitude throughout time at a certain location due to climate variability (Hsu and Dirmeyer, 2022)
SMSURF is used as part of SM–T, as the surface soil layer shows the strongest coupling with the PBL (Dirmeyer et al., 2021) and is thus the most relevant in correlation analysis. A sensitivity analysis within our study (not shown) illustrates that the sign of the correlations, including SMSURF (TMAX:SMSURF and SMSURF:EF) remains qualitatively the same if replaced by the weighted mean SM across all soil layers, as also reported in Fu et al. (2024) and Schwingshackl et al. (2017). Although evaporation (or LH) can be adopted in the coupling analysis, EF is advantageous as its variability is not directly tied to net radiation and wind speed (Qiu et al., 2020), making it a more suitable measure of land surface dryness (Ukkola et al., 2018). Using evaporation alone can obscure the impact of SM on the L–A interactions (Qiu et al., 2020). Given the recent inclusion of SH in GLEAM 4.1a, which enables calculation of the EF, the GLEAM-E-OBS dataset is prepared to accompany the WRF-CTSM simulations in the coupling analysis.
3.1 WRF-CTSM and GLEAM-E-OBS evaluation
A station-based evaluation of WRF-CTSM simulations and GLEAM-EOBS for daily SMSURF, EF, TMAX, SH, LH, and total PR is presented in Fig. 3. The mean across the five stations and gridded datasets (Fig. 3) is computed after masking the daily values of each gridded dataset according to the missing observations of the corresponding station. Additionally, the mean of RNET and its radiative fluxes is available for three out of five stations (Norunda, Hyltemossa, and Degerö) presented in Fig. S1 in the Supplement. These local-scale comparisons are addressed in the following two sections.
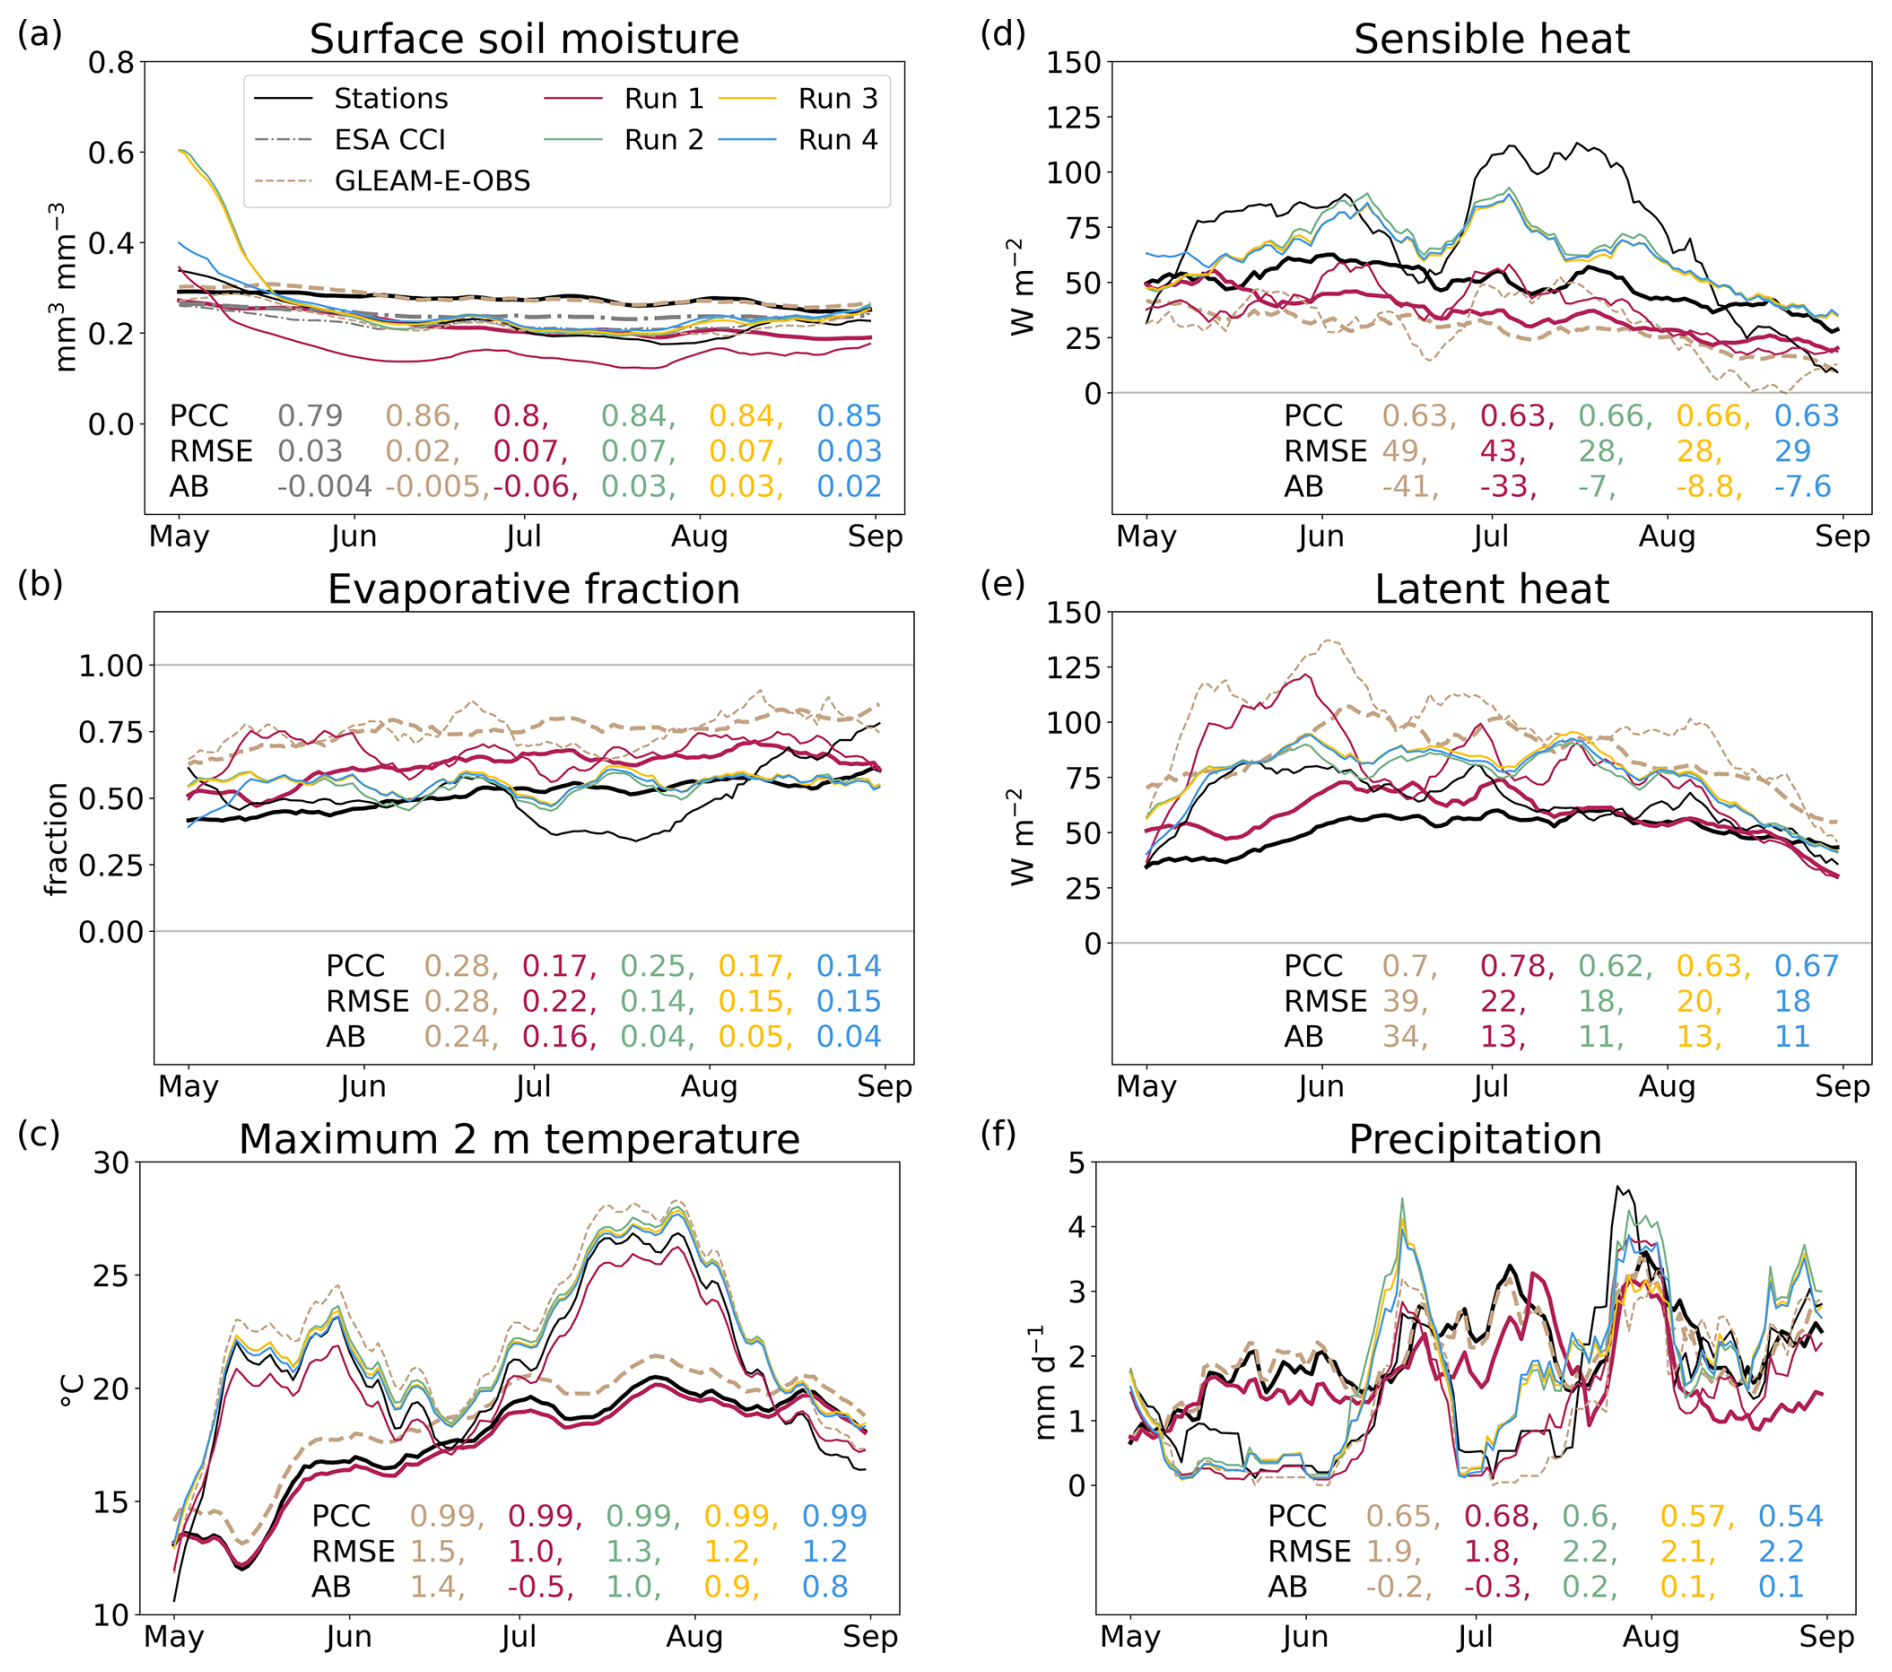
Figure 3Grid cell level evaluation of WRF-CTSM simulations and GLEAM-E-OBS dataset against in situ observations averaged over five stations, illustrated as a 10 d centered running mean time series. Thin lines represent MJJA 2018, while thick lines (stations, ESA CCI, GLEAM-E-OBS, and Run 1) denote the mean of the preceding three years for which data are available at all considered stations (2015–2017). Key soil moisture–temperature coupling variables are evaluated in panels (a)–(c). Surface soil moisture depths are 0.05 m (ESA CCI) and 0.1 m (stations, GLEAM-E-OBS, and Runs 1–4). Evaporative fraction values are constrained between 0 and 1. Evaluation metrics in the bottom right are for daily values during MJJA 2018 and calculated relative to the station data. They include the Pearson correlation coefficient (PCC), root mean square error (RMSE), and absolute bias (AB) described in Sect. S2.
3.1.1 Surface soil moisture evaluation
This section includes a validation of SMSURF from ESA CCI against station data to ensure its suitability in reproducing in situ observations and serving as a regional-level SMSURF evaluation dataset despite initially being provided on a coarser resolution (0.25°) than the WRF-CTSM and GLEAM-E-OBS datasets (0.1°). Additionally, ESA-CCI represents a shallower soil depth layer (0.05 m) than the other datasets (0.1 m). In Fig. 3a, the evaluation metrics consistently indicate that the GLEAM-E-OBS SMSURF is the most aligned with the in situ observations; the slightly higher absolute bias compared to ESA CCI is negligible. ESA CCI and Run 4 are also closely aligned with the station data. Run 1 SMSURF is the driest among datasets at the selected locations (underestimation against the stations is approximately 0.1 mm3 mm−3) throughout the MJJA 2018 period. The Run 1 underestimation is also depicted over most of the study region in comparison to ESA CCI (Fig. 4b), whereas this is not a prevailing pattern in GLEAM-E-OBS and Run 4 (Fig. 4a–c). The corresponding mean regional MJJA 2018 absolute SMSURF values in GLEAM-E-OBS, Run 1, and Run 4 are presented in Fig. S2. Figures 4 and S2 show that the bias pattern among datasets aligns with the spatial distribution of SMSURF. Regions characterized by higher mean SMSURF values (northwest, mountainous areas) exhibit positive biases, while regions with lower SMSURF values (southeast) show negative biases relative to ESA CCI. These summer SMSURF WRF-CTSM biases could be attributed to several sources, including biases in simulated precipitation, parameterizations in the land and atmosphere models, differences in soil depth, soil texture, freeze-thaw representation, vegetation type and properties, as well as the discrepancy between point scale observations and the model grid cell size (Li et al., 2020).
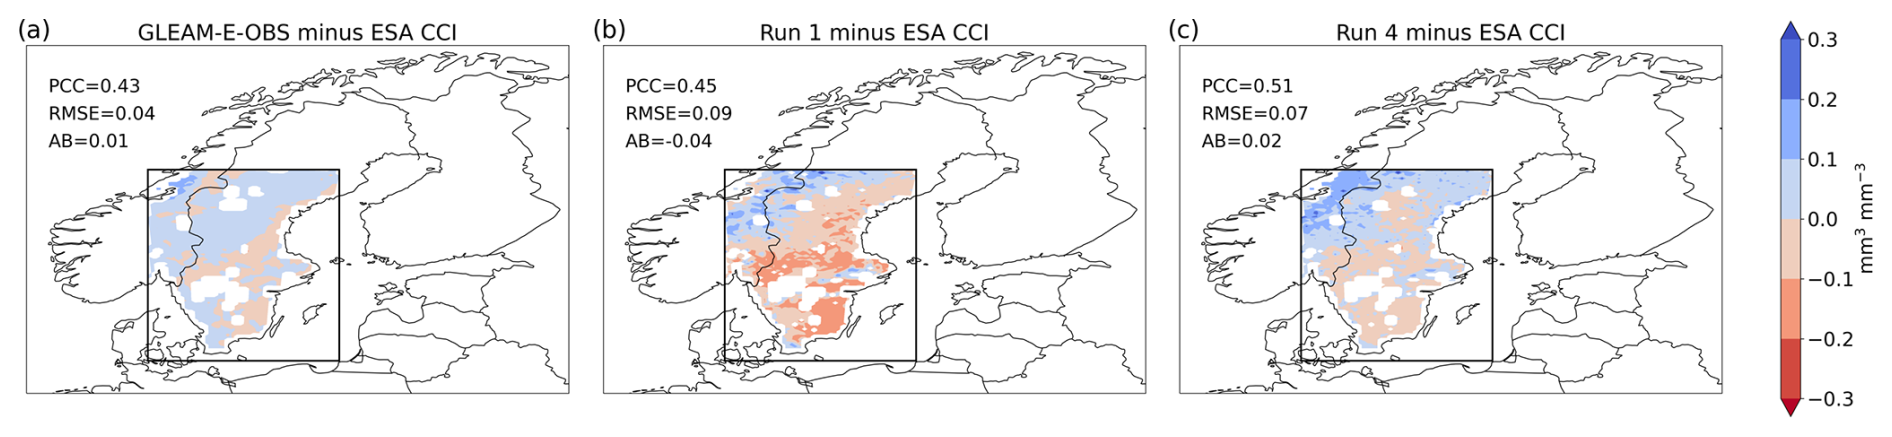
Figure 4Mean regional MJJA 2018 surface soil moisture absolute bias for (a) GLEAM-E-OBS, (b) Run 1, and (c) Run 4 against ESA CCI. Surface soil moisture depths are 0.05 m for the ESA CCI product and 0.1 m for GLEAM-E-OBS, Run 1, and Run 4. Regional scale evaluation metrics in the upper left section of each panel include Pearson correlation coefficient (PCC), root mean square error (RMSE), and absolute bias (AB), described in Sect. S2.
3.1.2 Evaluation of near-surface meteorological and energy flux variables
WRF-CTSM simulations and GLEAM-E-OBS illustrate an overestimation of LH throughout most of MJJA 2018 compared to station data (Fig. 3e). On the contrary, SH is generally underestimated (Fig. 3d). The magnitude of the respective biases is the highest in July 2018, which, according to Dirmeyer et al. (2021), represents the month of the most pronounced L–A interactions over the study region. Run 1 and GLEAM-E-OBS commonly indicate distinct temporal patterns as opposed to Runs 2–4, which are more closely aligned, likely due to their similar setups. When all metrics from the LH and SH station-based MJJA 2018 evaluations (Figs. 3d–e and S4–S8, summarized in Table S2) are considered, Run 4 yields the best overall performance. Accounting for the MJJA period and all evaluation metrics, GLEAM-E-OBS has the lowest performance as it shows a more pronounced overestimation of LH and underestimation of SH throughout MJJA 2018 (Fig. 3d–e). This is combined with the highest MJJA TMAX (Fig. 3c) among the datasets, underpinning that the key coupling variables in GLEAM-E-OBS are independent and derived from different sources. However, considering the SH and LH throughout July specifically (Fig. 3d–e), GLEAM-E-OBS shows improved performance as it reproduces the decreasing EF tendency observed in data from most stations (Figs. 3b and S4–S8). GLEAM–E-OBS does not consistently outperform the WRF-CTSM simulations in PCC for LH and SH at the station level during MJJA or July 2018. Nevertheless, it does show a higher PCC in MJJA 2018 when all key coupling variables are considered together (Tables S2 and S3). Correlation analysis is particularly relevant in our SM–T assessment, although in that context it primarily refers to the correlations among the key coupling variables within each dataset.
Accurately simulating EF is the most challenging among the key coupling variables. EF is sensitive to local surface SH and LH variations (including, e.g., intermittent cloudiness) and thus fluctuates throughout the warm period. Wang et al. (2019), in their station-based analysis during and outside heatwave periods, found that the EF reduction throughout heatwaves largely varies among study sites depending on local climate conditions, soil properties, and land cover types, but also within the same land cover type, indicating that responses are species-dependent. Hence, in contrast to the grid cells of the evaluated datasets, station observations are more sensitive to local fluctuations and show a higher magnitude in SH and a larger decrease in EF throughout July (Fig. 3b).
The high accuracy of the WRF-CTSM simulations and GLEAM-E-OBS in representing in situ daily TMAX is further illustrated in Fig. 3c. The mean daily TMAX MJJA 2018 PCC is 0.99 in all evaluated datasets. Considering also RMSE and AB, WRF-CTSM simulations are marginally more precise in representing the daily TMAX than GLEAM-E-OBS (Fig. 3c). As expected, high surface warming is accompanied by high RNET (Fig. S1). However, the RNET is in Runs 2–4 represented through compensating fluxes, as the underlying processes differ from the observations. Runs 2–4 overestimate incoming solar radiation and underestimate longwave fluxes, implying reduced cloud cover (Fig. S1). Lower SH from a colder surface coincides with higher TMAX, suggesting underestimated turbulent transport and associated cloud cover biases in the WRF-CTSM simulations. WRF has several options for PBL schemes, and a different choice could have potentially improved the results (e.g., Wang et al., 2021a), but it is beyond the scope of our study to assess a wide range of different schemes in WRF. Issues with cloud representation may have also contributed to a slight overestimation of PR (Fig. 3f) in Runs 2–4, likely driving the LH increase during July. Although not consistent across all sites, GLEAM-E-OBS PR generally aligns more closely with observations than Runs 2–4 (Table S4).
3.2 Anomalies in MJJA 2018
GLEAM-E-OBS and Run 1 generally agree on the areas of the most pronounced MJJA 2018 anomalies in SMSURF, LH, SH, and TMAX compared to the mean MJJA of other years throughout 2010–2022 (Fig. 5). The negative SMSURF and positive TMAX anomalies are spread over the entire study region in both datasets, as also shown by previous studies using ERA5 reanalysis on 0.25° resolution (Dirmeyer et al., 2021; Tak et al., 2024). Our study further emphasizes that a reduced EF (as depicted by anomalously low LH and high SH) persisted the longest in the southeastern part of Sweden (Fig. S9). This area thus reveals the most favourable conditions for the shift towards a transitional SM regime. This aligns with Sjökvist et al. (2019), who demonstrate that the confined areas of the southeastern part of Sweden had the longest number of consecutive heatwave days (up to 30 d), defined as days where the daily mean temperature exceeds 20 °C.
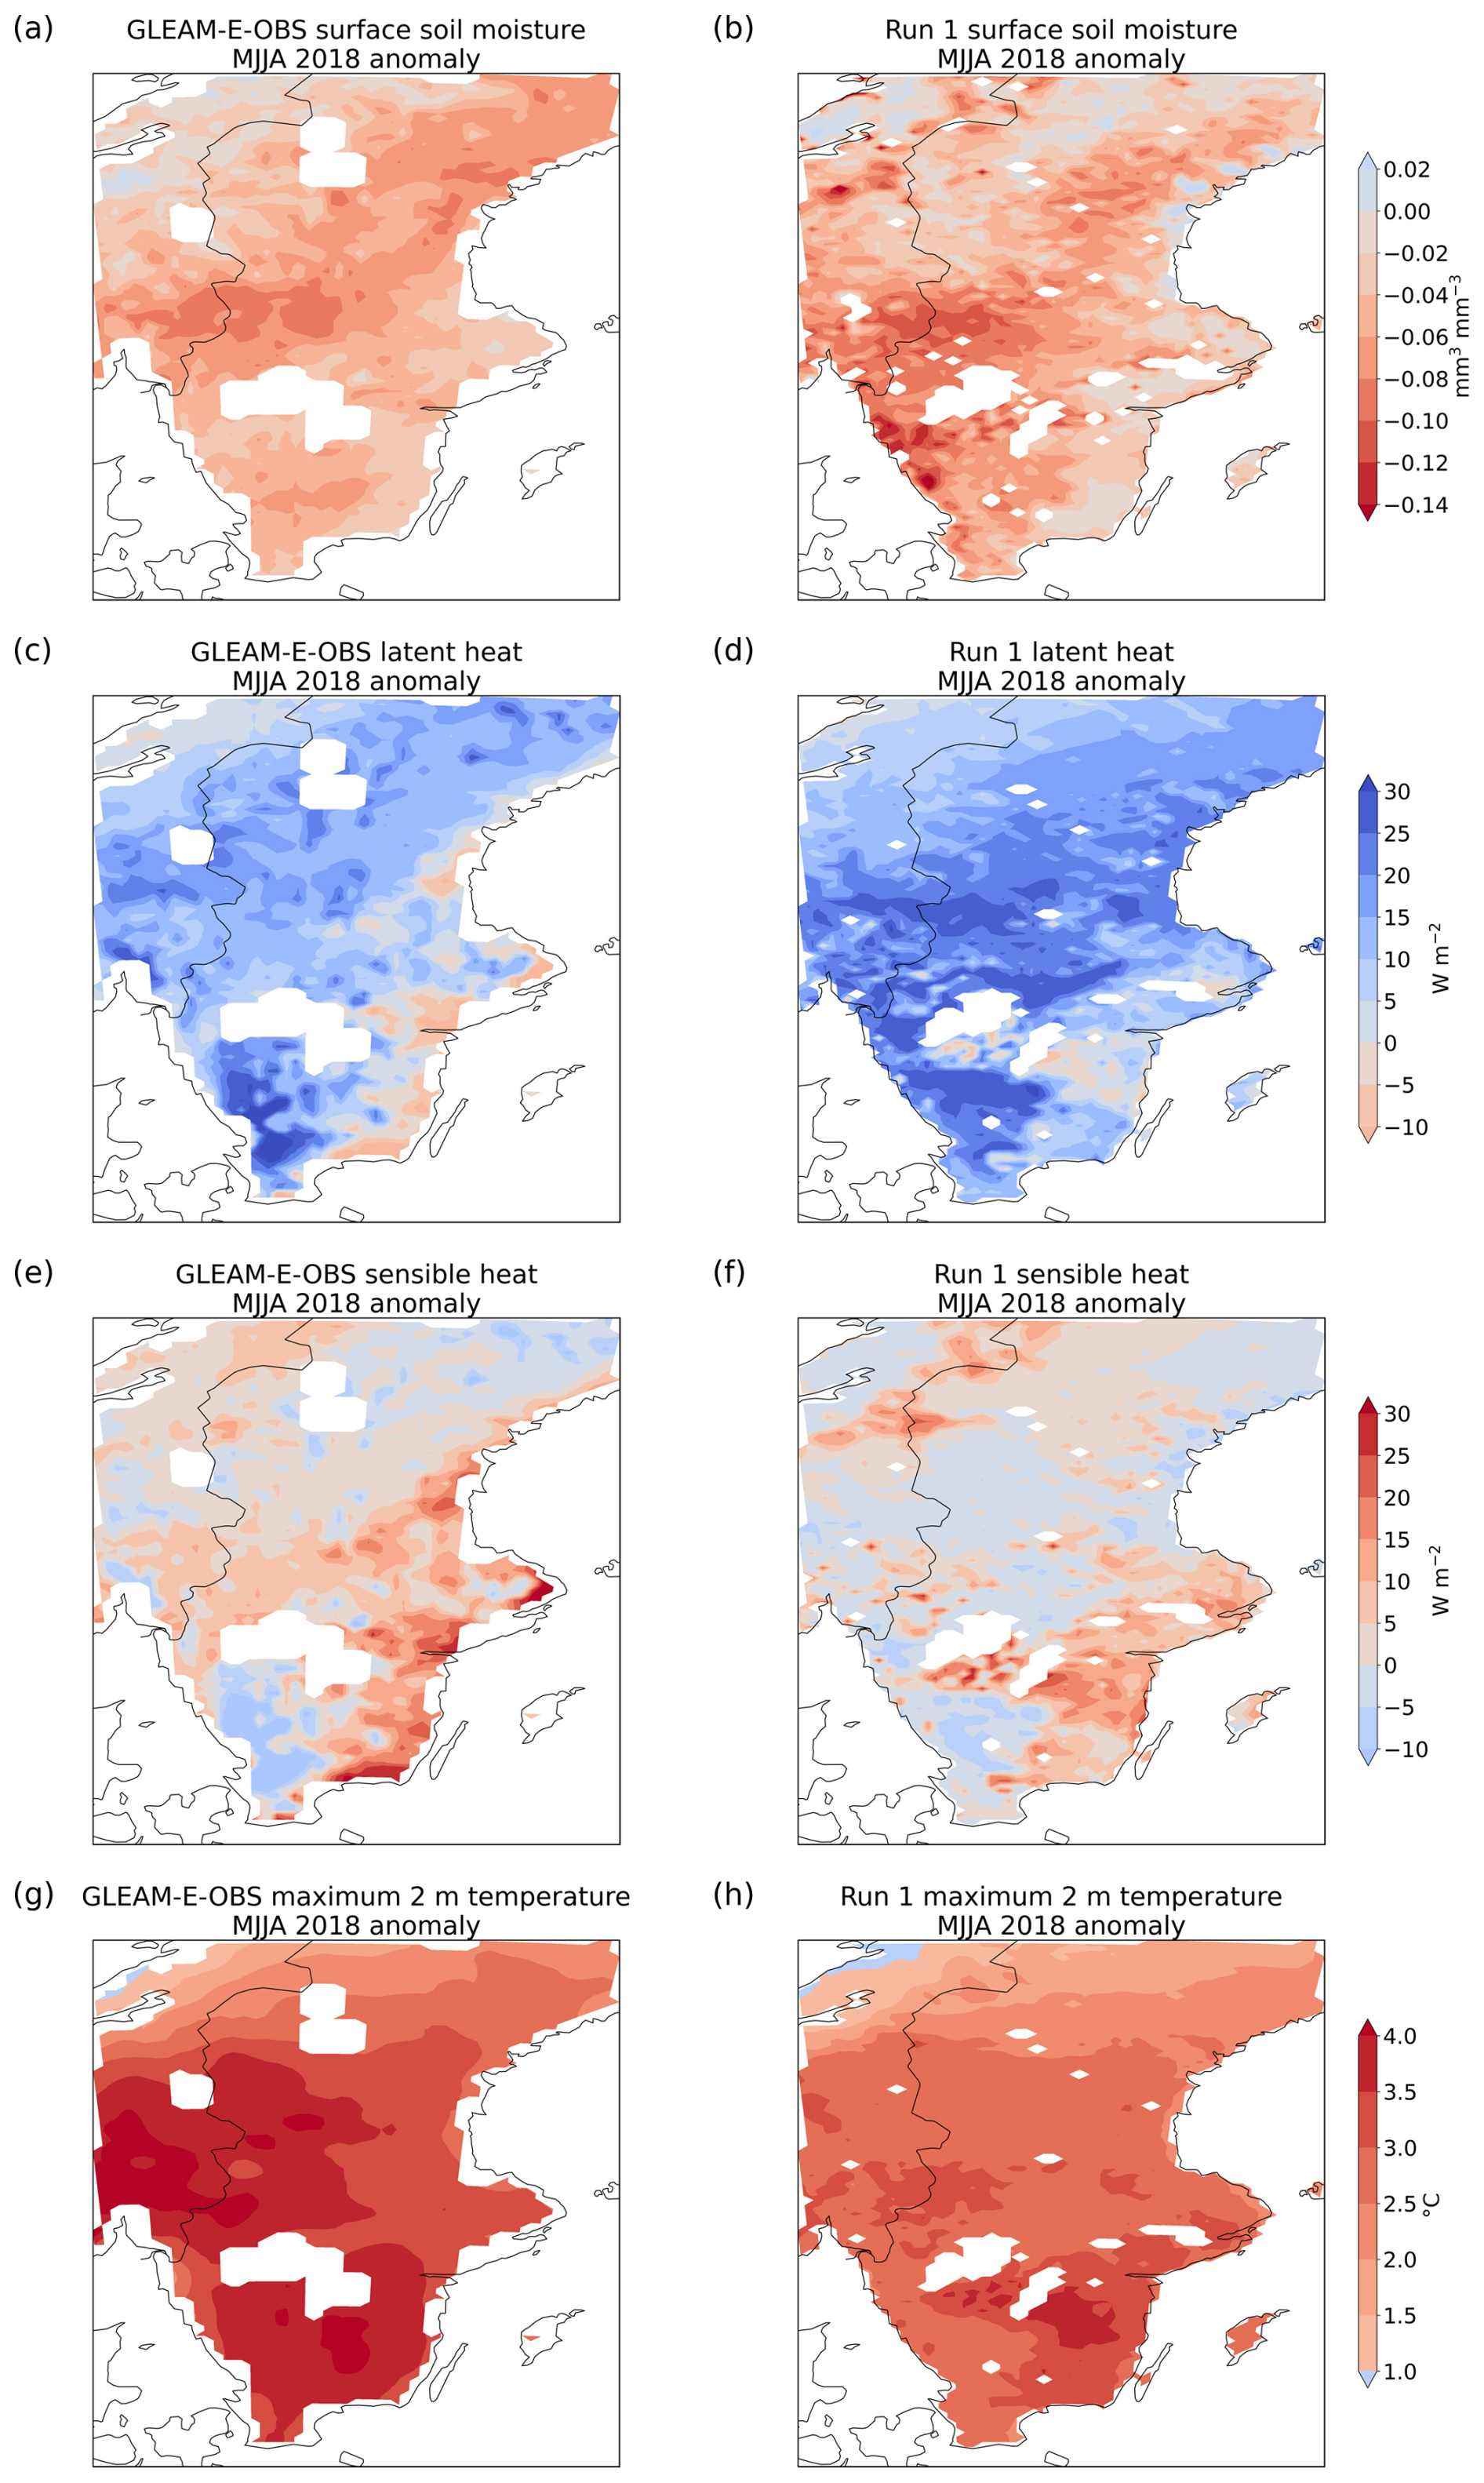
Figure 5Mean MJJA 2018 anomalies in SMSURF, LH, SH, and TMAX in GLEAM-E-OBS (left column) and Run 1 (right column) based on the MJJA 2010–2022 reference period, excluding the year 2018.
3.3 Soil moisture–temperature coupling
3.3.1 Robust regional-scale patterns
A regional-scale SM–T during MJJA 2018 in GLEAM-E-OBS and the four WRF-CTSM simulations is presented in Fig. 6. The first column shows the spatio-temporal coverage of the complete coupling across all datasets, while the subsequent columns display the areas and durations of the individual coupling components. On average across the study area and all datasets, the complete SM–T persisted for 22 d. There is, however, a disparity in the total coverage and coupling duration among datasets (these differences are discussed in Sect. 3.3.2 and 3.3.3).
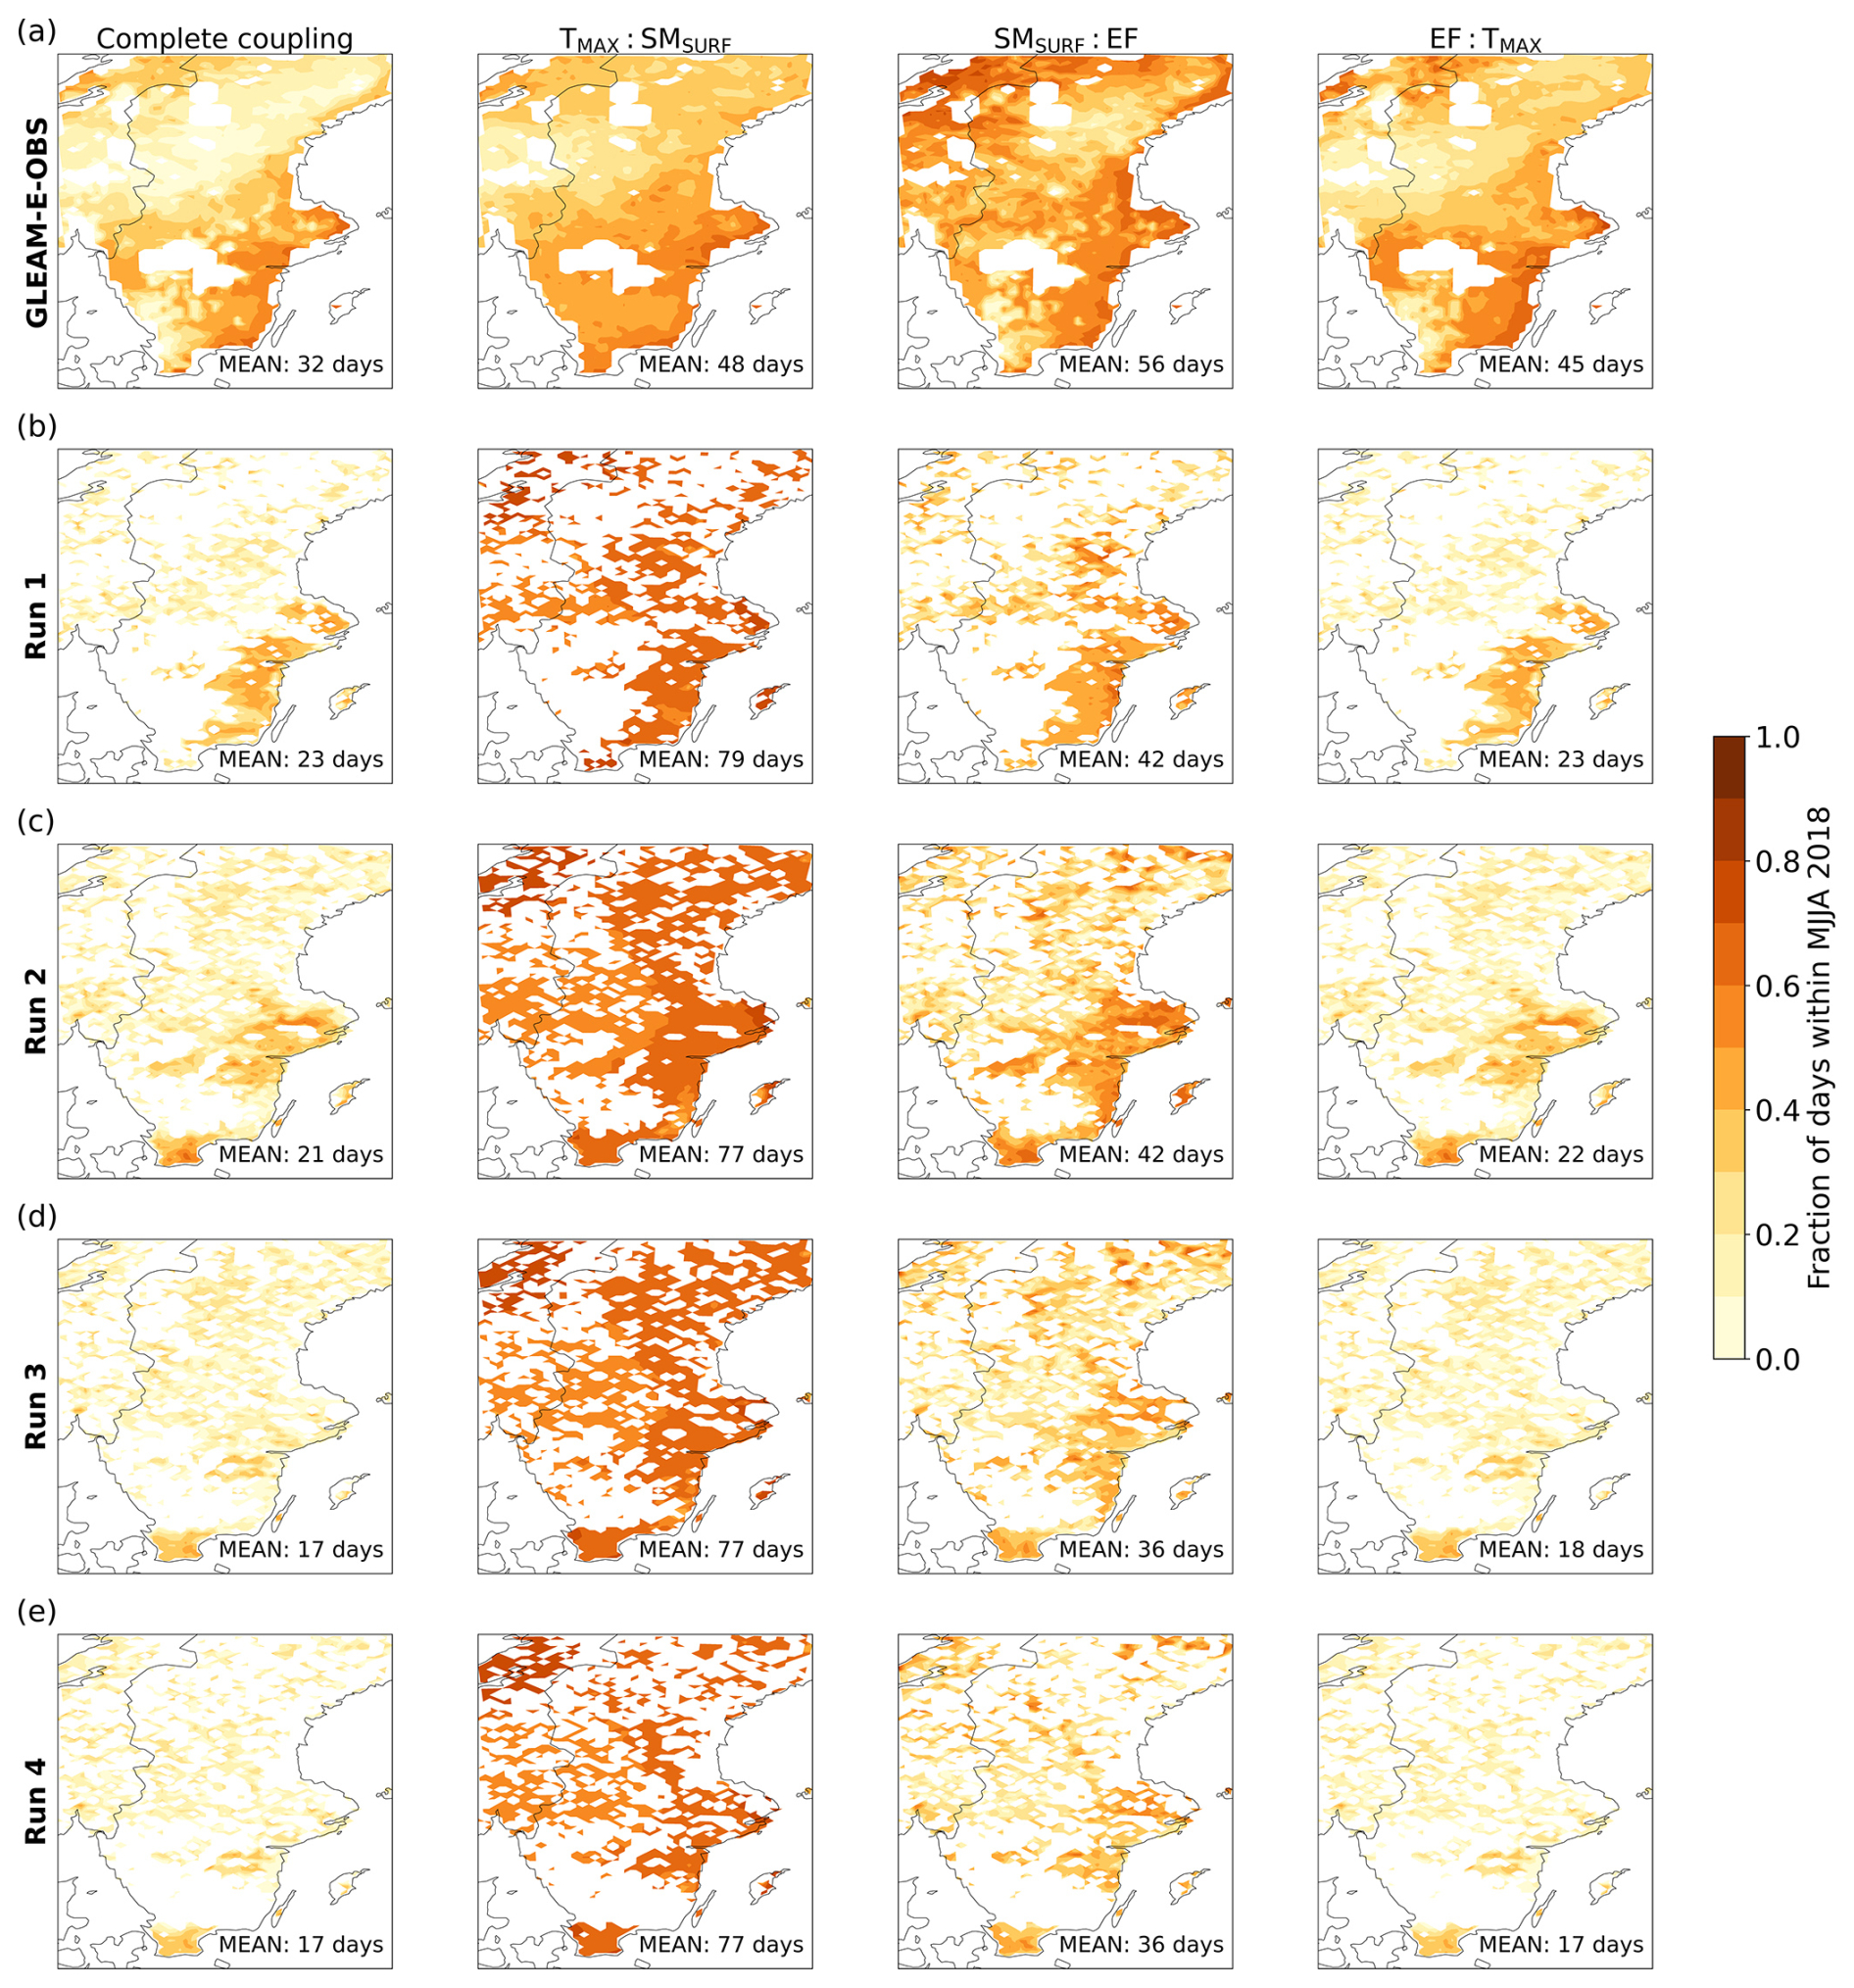
Figure 6Fraction of days during MJJA 2018 that experienced soil moisture–temperature coupling. A time series of Pearson correlation coefficients (PCC) at each grid cell is based on 92 d running periods. Rows (a)–(e) denote regional datasets while columns demonstrate the parts of the coupling analysis, namely complete coupling, negative TMAX:SMSURF, positive SMSURF:EF, and negative EF:TMAX correlations, respectively, each co-occurring with increasing TMAX. The mean duration over the study region is additionally indicated in each plot.
Overall, it is common for all datasets that the spatial pattern of the complete SM–T duration generally follows the pattern of the duration of the atmospheric leg (EF:TMAX) (first and last columns in Fig. 6). This reflects a strong control of the atmosphere, particularly surface net radiation, temperature, and vapor pressure deficit (VPD) on EF (Wang et al., 2019) in high-latitude regions dominated by an energy-limited evaporation regime (Schwingshackl et al., 2017; Seneviratne et al., 2010). This is supported by the prevailing positive anomalies in LH throughout MJJA 2018 in station data, GLEAM-E-OBS, and Run 1 on in situ (Figs. 3e and S4e–S8e) and regional (Figs. 5c–d, S11, and S14c–d) scales. The respective regional-scale analyses further indicate that although the magnitude of the positive TMAX anomaly is similar for May and July 2018 (locally exceeding 6 °C), the positive anomaly in evaporation is less pronounced and widespread in July, when most of the coupling occurred (Dirmeyer et al., 2021).
Given the strong control of changes in evaporation on coupling duration, the coupling analysis in our study disregards cases in which those changes are not part of the SM–T chain. By explicitly accounting for the condition of increasing TMAX, we exclude cases when enhanced LH cooled the surface, leading to lower SH and TMAX. Such cases typically occur during the early warm period when soils are still wet from snowmelt, or shortly after rainfall events during the warm season. This condition then rules out cases in which EF:TMAX reveals a negative relation, but the TMAX is dampening, or cases in which evaporation depletion is not relevant enough to trigger substantial changes in EF that would enhance the TMAX. Furthermore, observational-based studies in Sweden and central Europe indicate instances of decreased evaporation during the warm 2018 period due to increased VPD and a reduction in stomatal conductance, even when SM is still not limited (Lindroth et al., 2020; Salomón et al., 2022). This plant stress response is a L–A interaction that further enhances warming, although it does not involve the effect of SM depletion (Fu et al., 2022; Grossiord et al., 2020; Schönbeck et al., 2022; Sulman et al., 2016). These interactions commonly occur on daily timescales and are excluded from our SM–T definition, as it requires a co-occurrence of all correlations, thereby ensuring the necessary transition to the soil moisture–limited evaporation regime. These constraints on the definition thus partly explain why each of the gridded datasets in Fig. 6 exhibits areas of non-existent SM–T throughout MJJA 2018. Additional factors that shape the spatio-temporal pattern of the coupling are discussed in the following sections.
3.3.2 Regional differences between GLEAM-E-OBS and WRF-CTSM runs
The complete SM–T in GLEAM-E-OBS occurred over most of the study region and lasted the longest, on average, 32 d throughout MJJA 2018 (Fig. 6a). Coupling in WRF-CTSM covered a smaller area and lasted for 17–23 d, depending on the simulation. GLEAM-E-OBS, Run 1 and Run 2 demonstrate that the coupling persisted the longest in the southeastern parts of Sweden (up to about half of the MJJA 2018 period, ∼ 60 d). The reduced sensitivity to coupling in WRF-CTSM runs in the respective area in comparison to GLEAM-E-OBS is related to the PR overestimation, as depicted in the regional-scale anomalies in Run 1 (Fig. S15). As LH inherently varies following changes in PR during the dry period, more frequent increases in LH than in the observations, specifically during July (Figs. S4–S8), resulted in a shorter coupling in WRF-CTSM.
An additional factor contributing to the differences in spatio-temporal coupling patterns stems from how datasets represent vegetation response to extended warm and dry periods. Both GLEAM-E-OBS and WRF-CTSM are equipped to represent evaporation over vegetated areas during water-limited conditions. In GLEAM-E-OBS, plant evaporation is estimated with a machine-learning approach that accounts for vegetation characteristics such as height, optical depth, and LAI, and incorporates plant access to groundwater (Hulsman et al., 2023; Miralles et al., 2025). WRF-CTSM additionally includes stomatal conductance and plant hydraulic parameterizations (Kennedy et al., 2019; Lawrence et al., 2019; Medlyn et al., 2011). As a result, WRF-CTSM includes more processes related to vegetation physiology when simulating evaporation. A lower complexity of factors leading to simultaneous correlations in GLEAM-E-OBS may yield a smoother signal and longer overlay of correlations than in the WRF-CTSM runs.
3.3.3 Regional differences among WRF-CTSM runs
The spatial extent and persistence of the complete SM–T decreases from Run 1 to Run 4 (Fig. 6b–e), along with the inclusion of more factors for physical representation of evaporation. Since Runs 2–4 show improved performance across LH and SH compared to Run 1 (Table S2) and include a single setup change per simulation (although with multiple parameters), their differences are examined in more detail in this section. Figure 7 supports these comparisons by illustrating the regional mean MJJA 2018 absolute difference in the complete coupling duration, SMSURF, LH, SH, and TMAX between Runs 3 and 2 (reflecting the effect of including the PHS configuration) and between Runs 4 and 3 (demonstrating the impact of including the BHS configuration). The analysis of the specific biogeophysical parameters (e.g., vegetation hydraulic conductivity parameters, soil physiographic parameters) and their relative importance in the coupled and uncoupled CTSM configurations is, however, an ongoing community effort that is beyond the scope of this study (Dagon et al., 2020; Gao et al., 2021; Jiménez-Rodríguez et al., 2024; Zarakas et al., 2024).
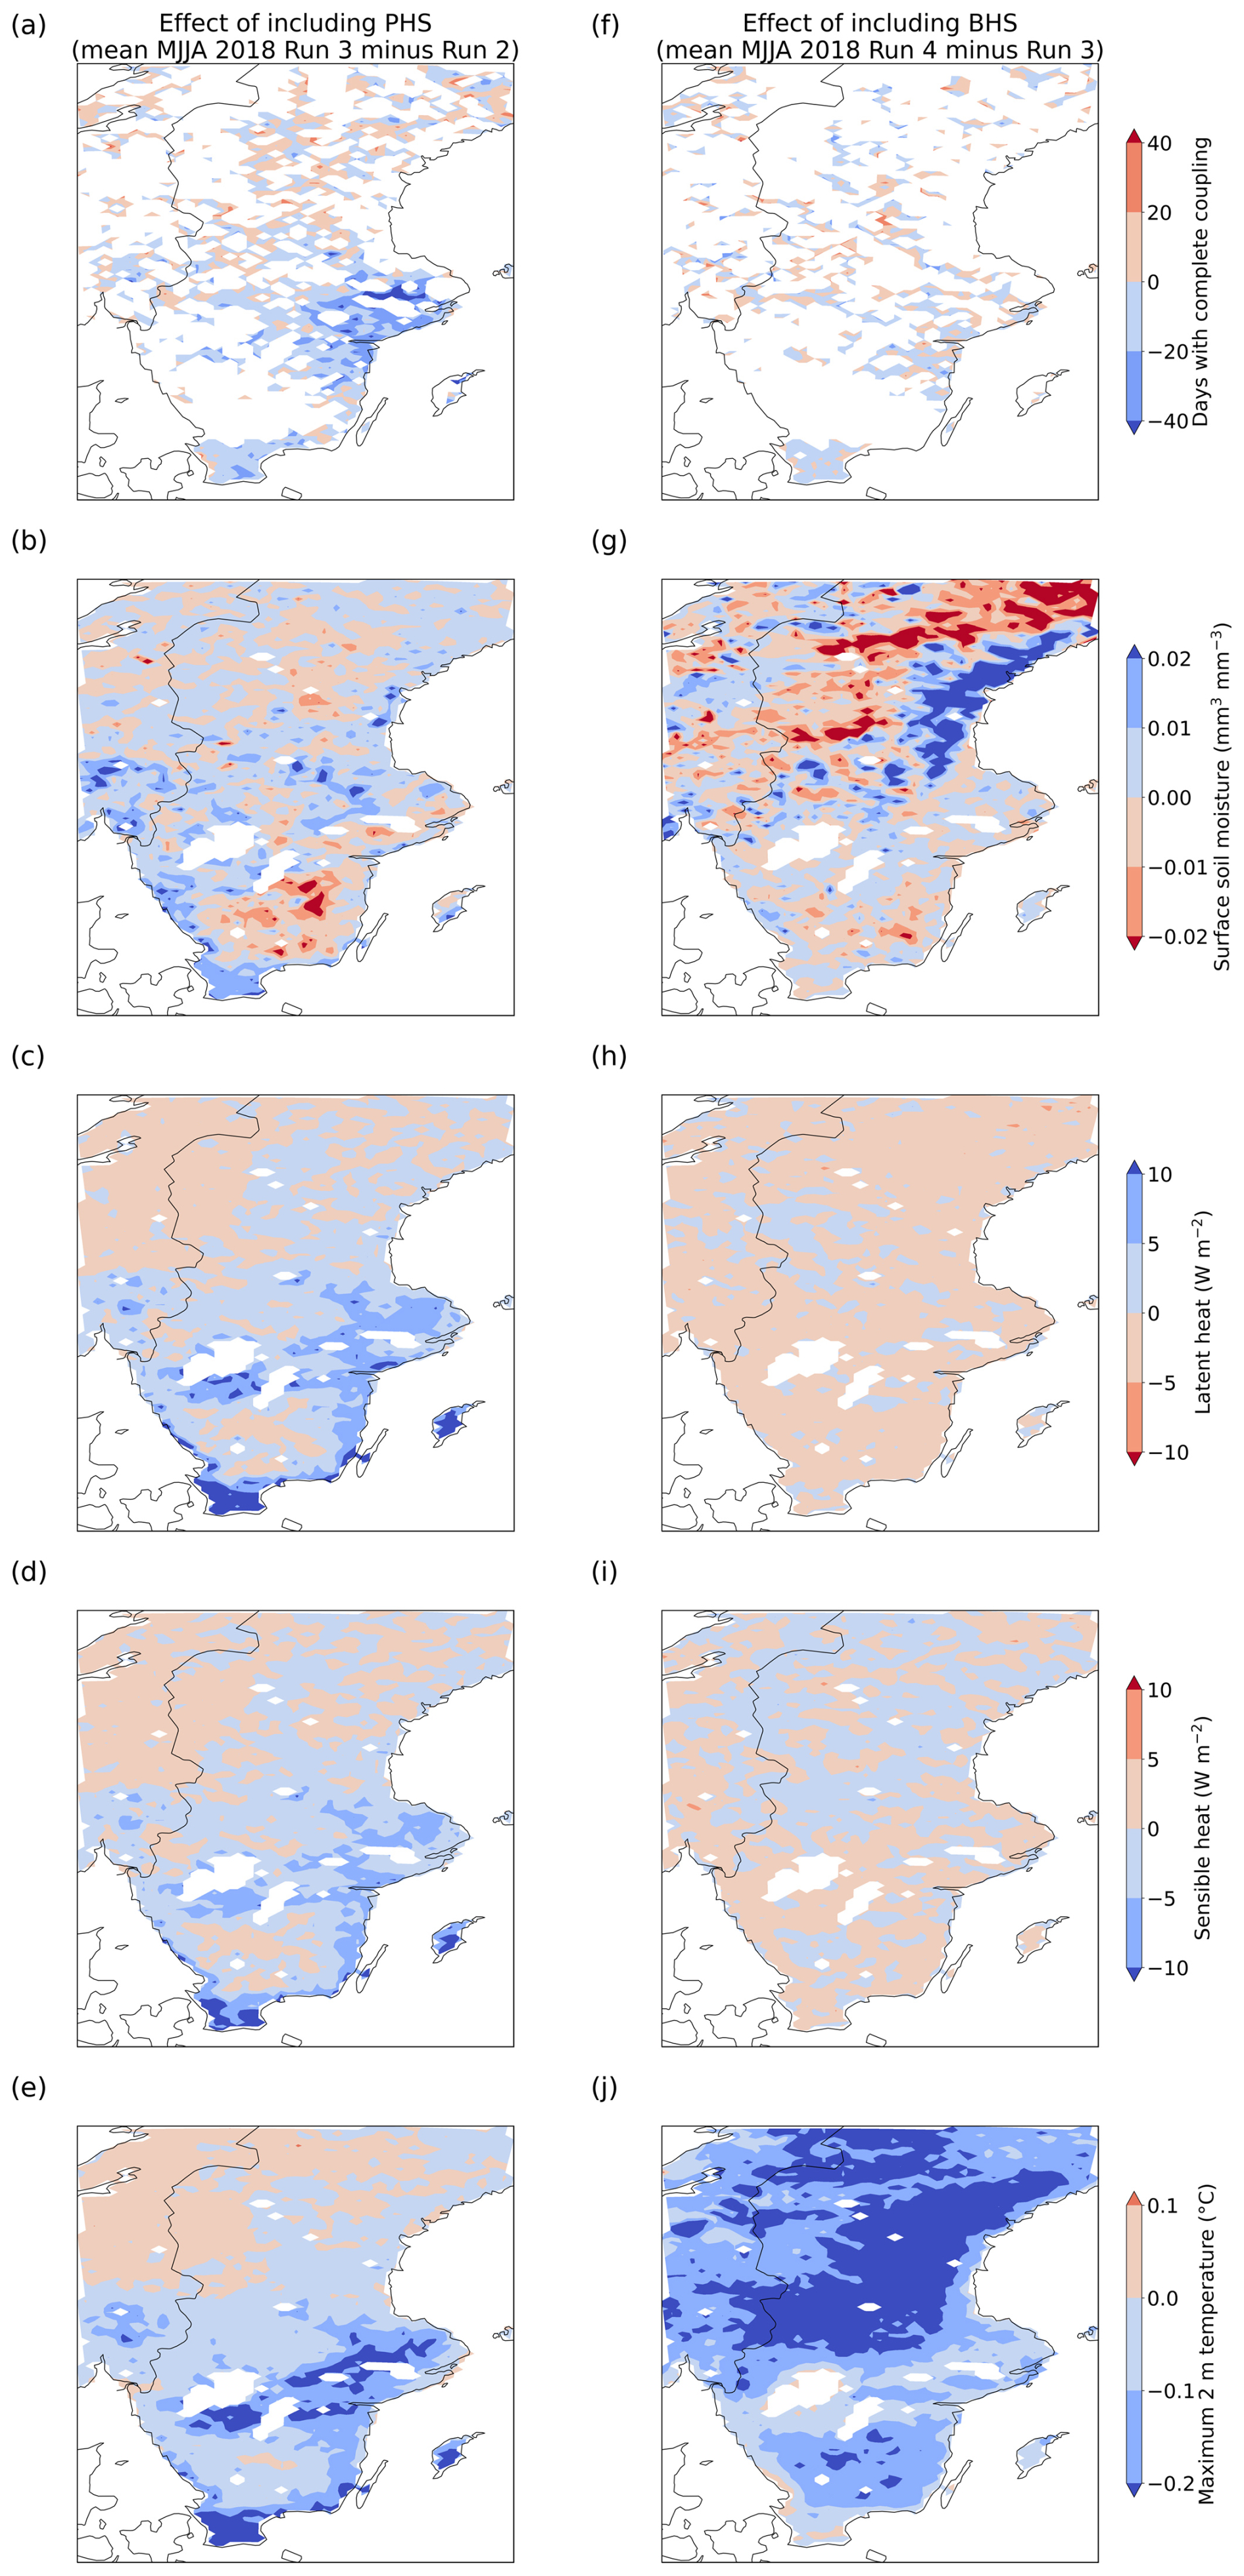
Figure 7The impact of including plant hydraulic stress (PHS) and biomass heat storage (BHS) configurations illustrated as an MJJA 2018 absolute difference between Runs 3 and 2 (a–e) and between Runs 4 and 3 (f–j) in the number of days with complete coupling (a, f), daily surface soil moisture (b, g), latent heat (c, h), sensible heat (d, i), and maximum 2 m temperature (e, j).
While both the PHS configuration in Run 3 and the soil moisture stress (SMS) configuration used in Run 2 account for changes in stomatal conductance due to SM deficit and atmospheric VPD, Run 2 does not include the plant hydraulic failure, as it cannot resolve concurrent limitations to stomatal conductance associated with declining soil water or excessive plant xylem tension. In contrast, Run 3 with PHS simulates hydraulic limits on plant transpiration by resolving plant water potential at the leaf, stem, and root levels. A higher evaporation in Run 3 (Fig. 7c) primarily refers to transpiration (Fig. S16c) and is likely a result of a compensatory root water uptake from deeper soil layers during water stress conditions (Kennedy et al., 2019).
The impact of additionally including BHS (Run 4) in the PHS run (Run 3) leads to a reduction in TMAX specifically over the areas with dense forest cover (Fig. S3), where the mean MJJA 2018 is reduced by up to 0.6 °C (Fig. 7j). This is expected since BHS reduces diurnal temperature variations in forests, owing to their high heat storage capacity of stems and leaves, to be more aligned with observations. In the BHS configuration, daytime TMAX is lower while nighttime minimum 2 m temperature is higher, resulting in a slightly elevated mean daily temperature (Meier et al., 2019). Accordingly, no pronounced changes are found in LH and SH (Fig. 7h–i).
The evaporation rates in this study region are likely strongly influenced by the needleleaf evergreen forest, which is the dominant land cover type (Fig. S3). Figure 8 provides insight into the regional-scale development of evaporation components throughout the MJJA 2018. The prevalence of forests reveals that canopy transpiration accounts for the largest share among the evaporation components and determines the overall evaporation pattern. On average over the study region, soil evaporation and canopy transpiration demonstrate a decline in early July. Canopy evaporation (or interception) accounts for the smallest share among the evaporation components, and is, as opposed to the other two, not affected by SM availability (Lawrence et al., 2020) but fluctuates due to changes in atmospheric conditions throughout the warm period (Wang et al., 2021b). The fraction of evaporation components as part of the total evaporation is analogous in Run 4 (Fig. 8) and Runs 1–3 (Fig. S16); however, their magnitudes differ due to the parameterizations used in those simulations (e.g., the stomatal behavior parameterization affecting transpiration rates).
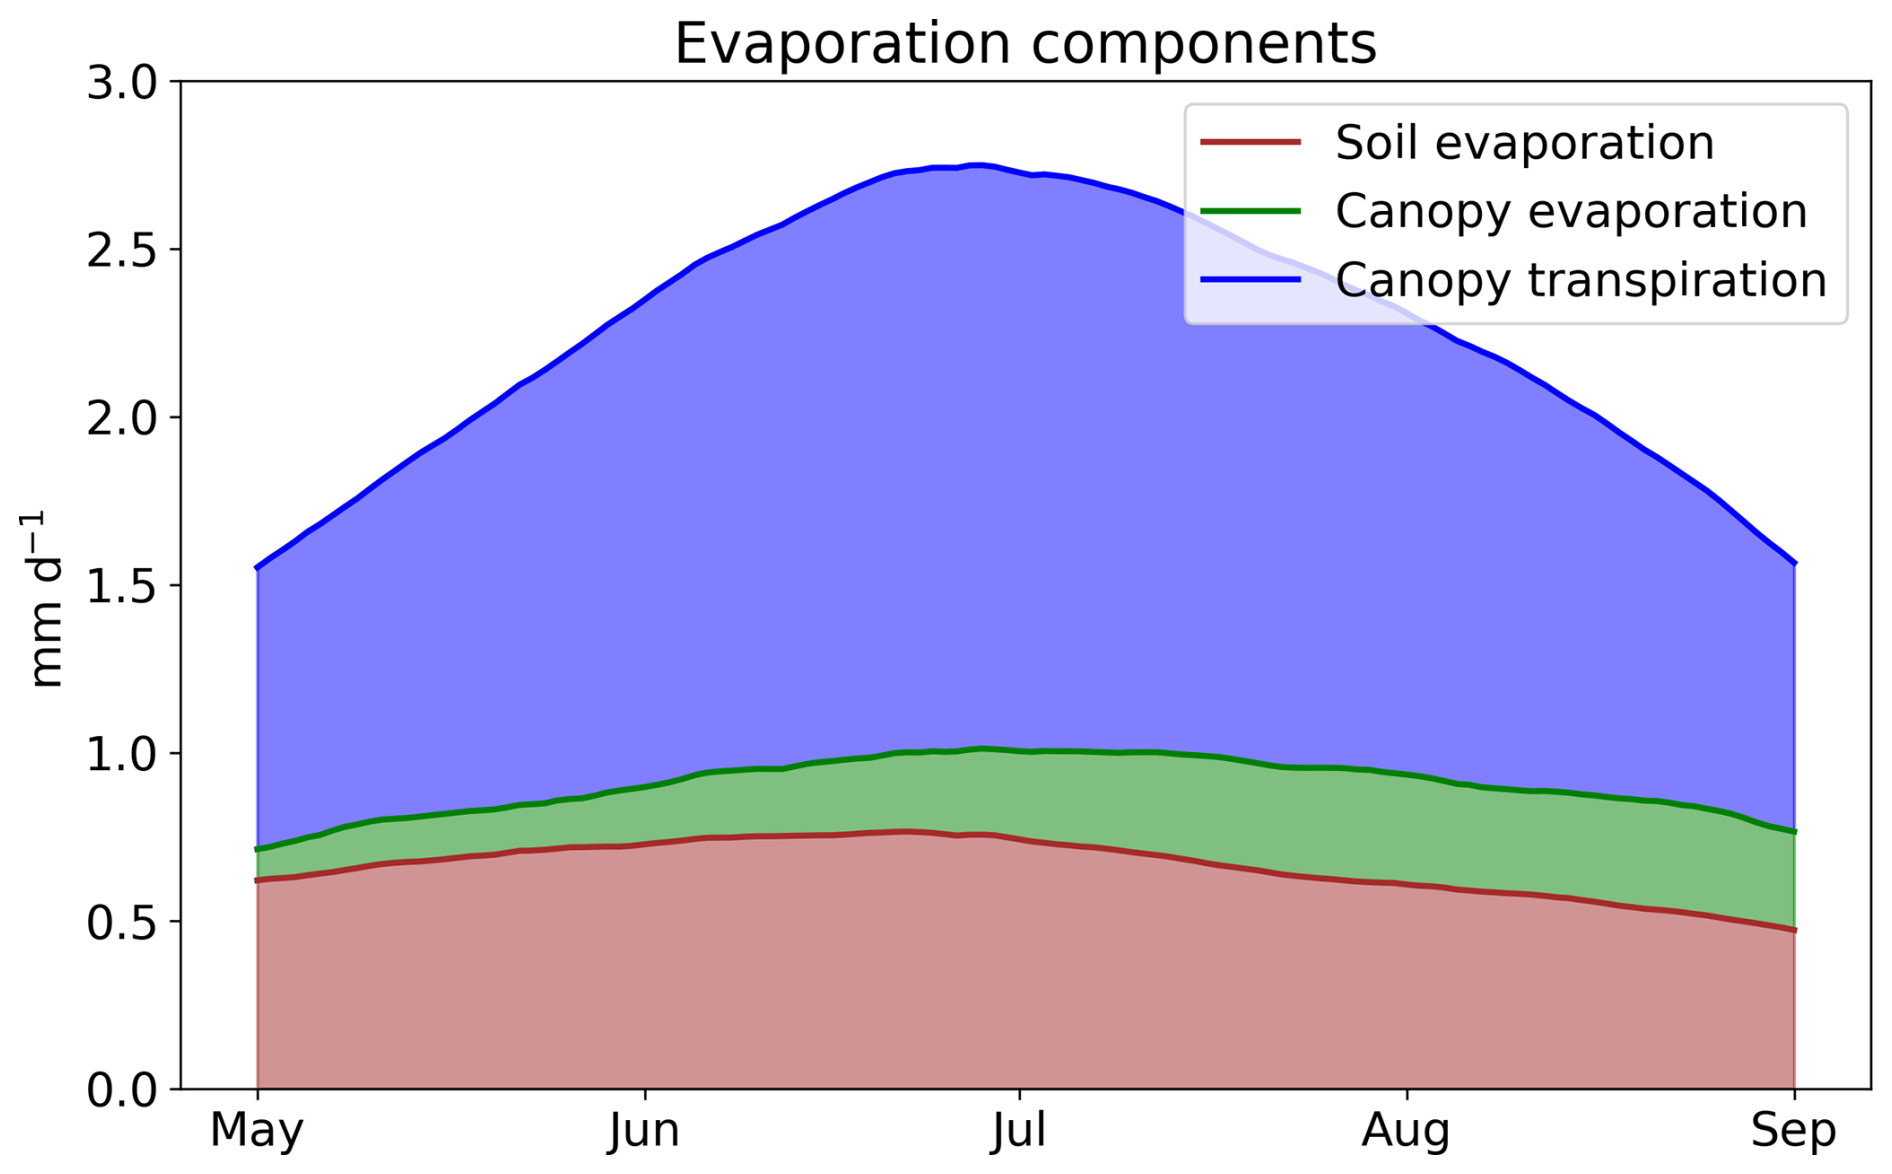
Figure 892 d centered running mean time series of evaporation components in Run 4 during MJJA 2018, averaged over the land grid cells in the study domain. Colored areas represent contributions of different evaporation components to the total evaporation, i.e., the sum of the colored areas at each time step represents total evaporation.
3.3.4 The role of coupling components
Since the complete SM–T closely follows the spatio-temporal coverage of the atmospheric leg (first and last columns in Fig. 6), Fig. 9 further demonstrates that the persistence of EF:TMAX has a major role in determining whether periodic shifts to a soil moisture–limited evaporation regime occur in this study region (as also indicated in Fig. 1). Figure 9 shows how the stand-alone duration of each coupling component contributes to the complete coupling duration in MJJA 2018. When considering only the atmospheric leg, the probability of estimating the duration of the complete coupling in this study region ranges from 67 % to 98 %, depending on the dataset. This indicates that while atmospheric leg accounts for the smallest number of days within the complete coupling (Fig. 6), it predominantly occurs at times when the other two coupling components are also met (Fig. 9). The regional average across GLEAM-E-OBS and WRF-CTSM simulations is 92 %, suggesting a high, but not definitive, ability to determine the coupling duration based only on the number of days spent in the negative EF:TMAX (with increasing TMAX) during MJJA 2018. A slight discrepancy between the persistence of the atmospheric leg and the complete coupling period resembles a need to integrate all coupling components in the SM–T definition. Studies accounting for the atmospheric leg only commonly include additional metrics to capture SM–T (Gevaert et al., 2018; Knist et al., 2017; Maraun et al., 2025). A decrease in the number of days in TMAX:SMSURF and SMSURF:EF as part of the complete coupling from Run 1 to Run 4 (Fig. 9b–e) likely indicates attenuation of the direct impact of SMSURF on the complete coupling duration as the evaporation becomes affected by additional factors (discussed in Sect. 3.3.3).
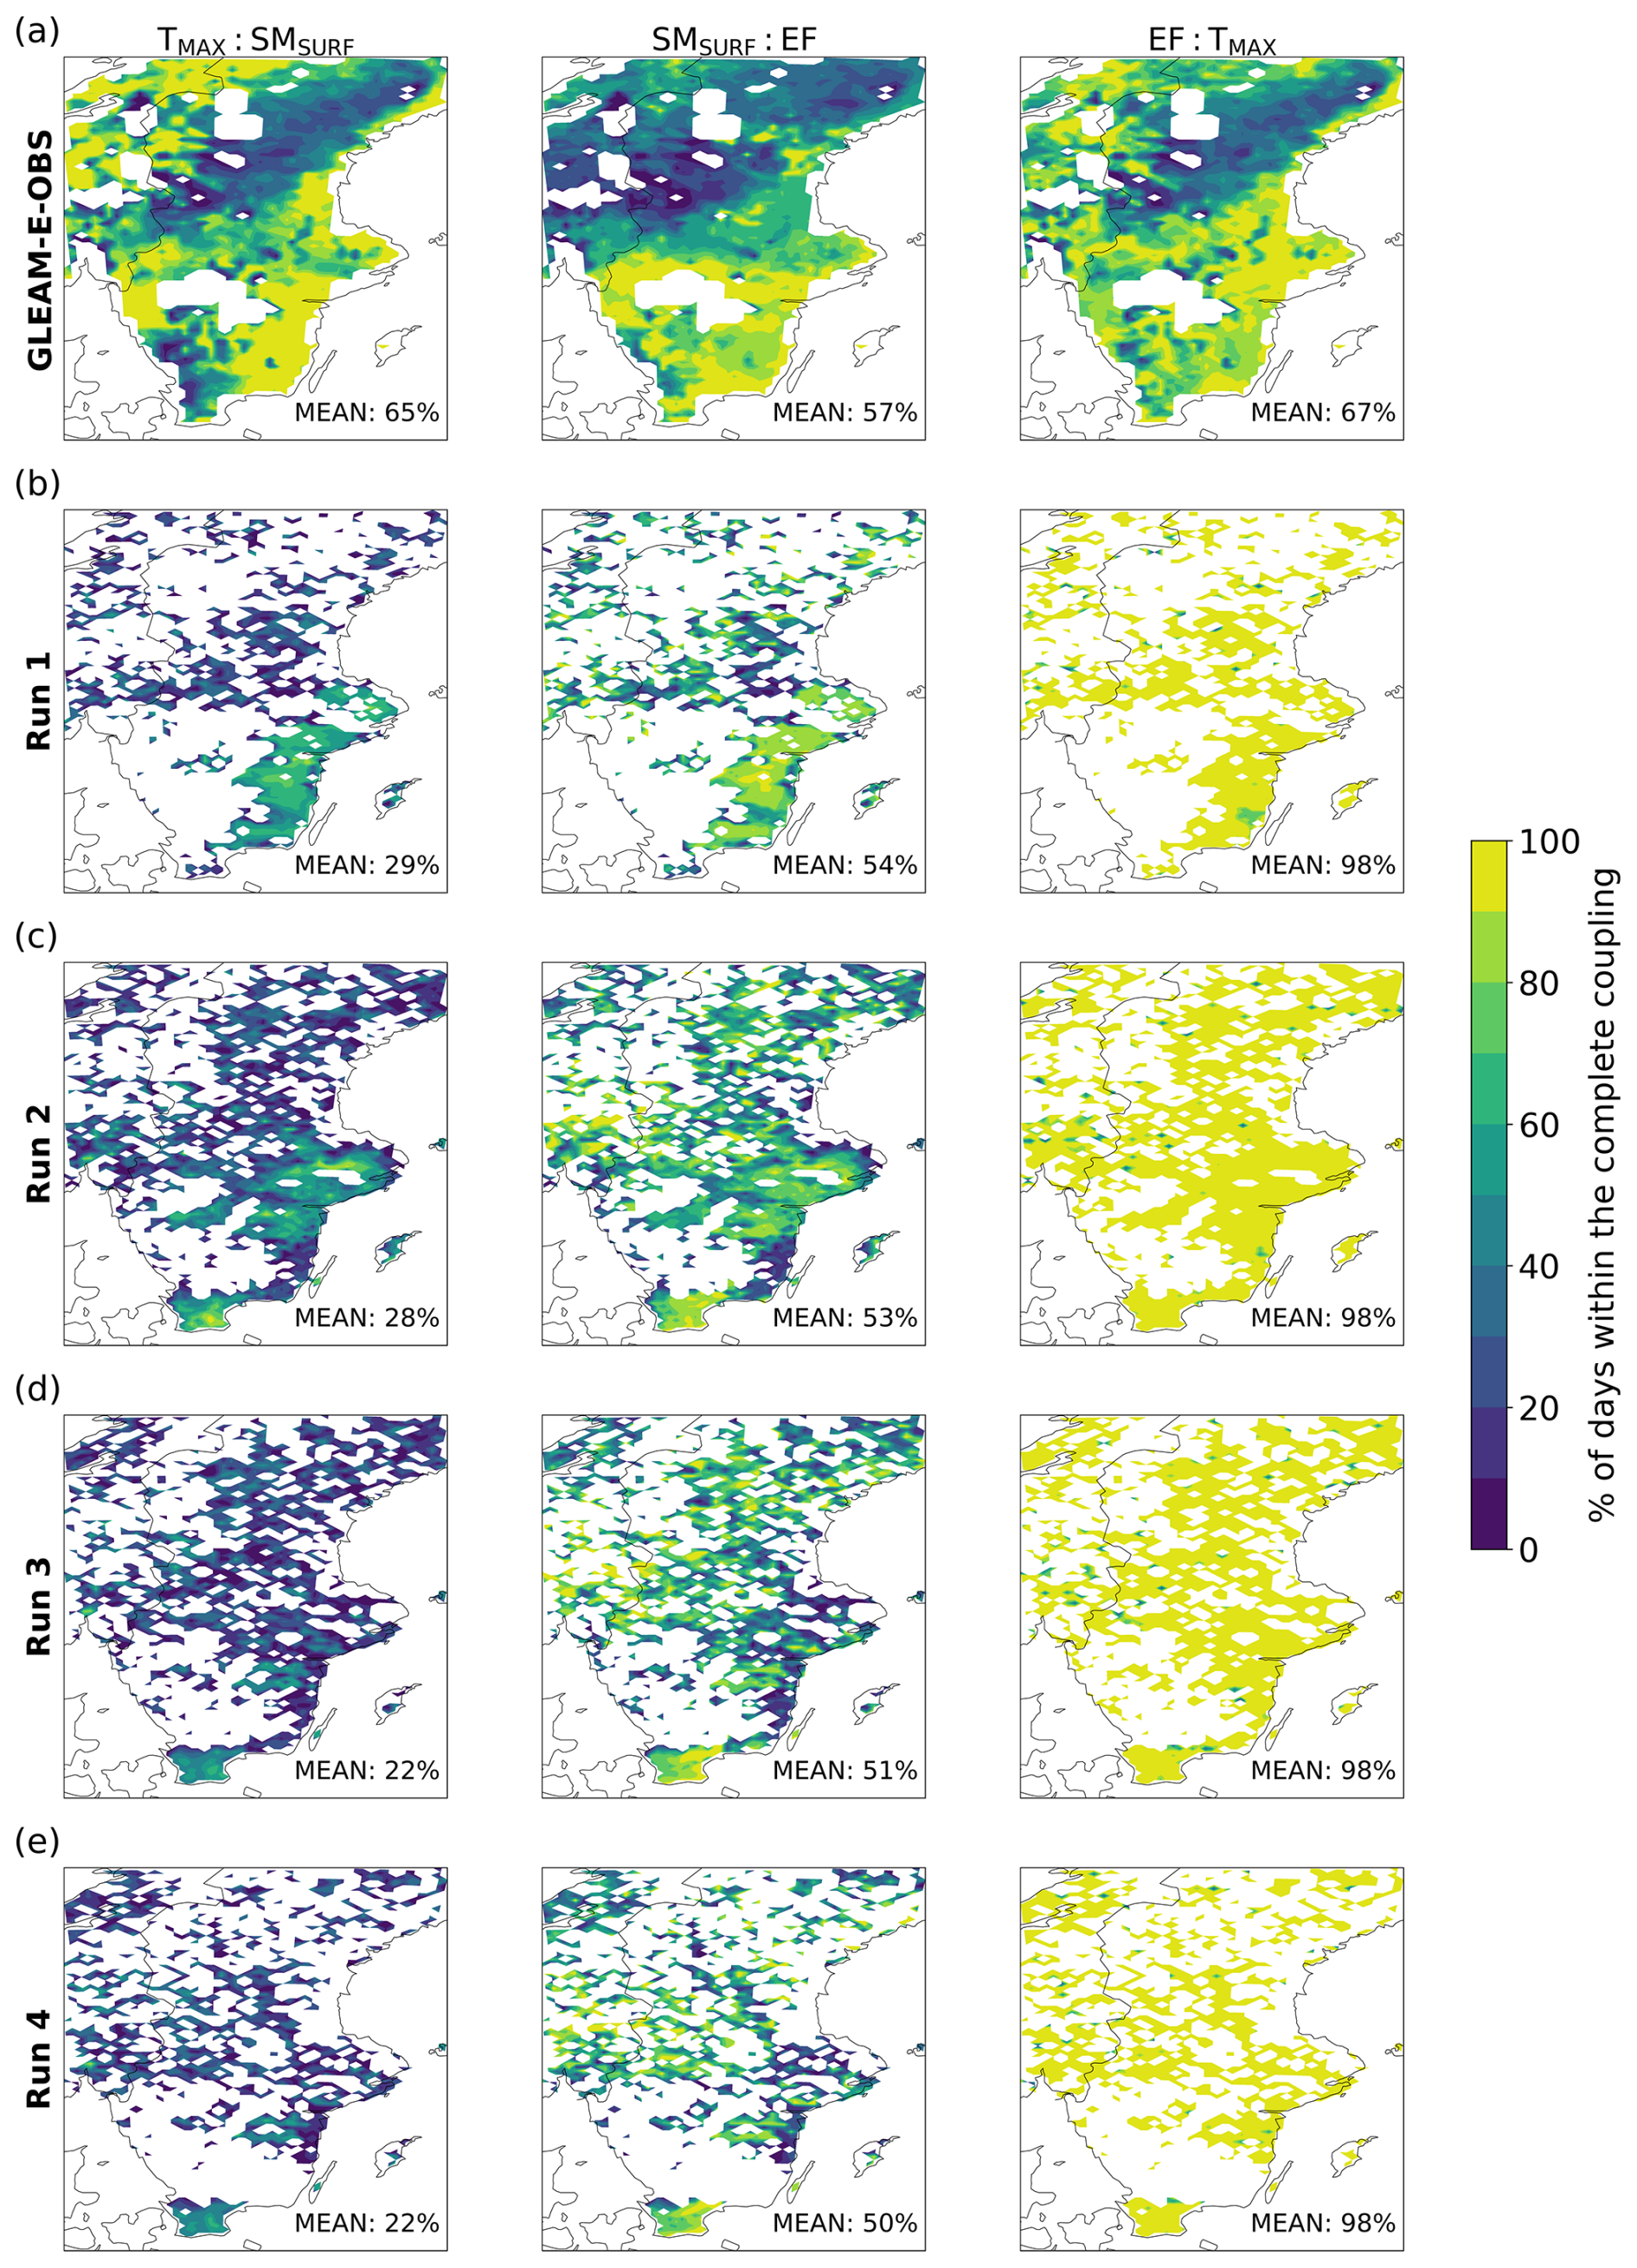
Figure 9The proportion of days spent in each of the three coupling components within the complete soil moisture–temperature coupling period. Rows (a)–(e) denote regional datasets while columns demonstrate the steps in the coupling analysis, namely negative TMAX:SMSURF, positive SMSURF:EF, and negative EF:TMAX correlations, each co-occurring with increasing TMAX. The proportion is calculated at each grid cell as a ratio of the number of days exhibiting the investigated correlation during the complete coupling and the total number of days spent in the respective coupling component during MJJA 2018. The mean proportion over the study region is additionally indicated in each plot.
3.3.5 Coupling at the in situ scale
The SM–T duration throughout the MJJA 2018 period at each of the five stations (Fig. 2), as well as in the corresponding nearest grid cells of GLEAM-E-OBS and Runs 1–4, is presented in Figs. S17–S22. Due to the temporal discontinuities in the stations' data for selected variables, the multi-correlation overlay analysis is based on 92 d, or 10 d as a minimum, running periods. The complexity of factors at the local scale resembles a lack of consistency in the matching periods of complete coupling across datasets. As the analysis is based on daily timescales, it involves frequent fluctuations of the key coupling variables (Findell et al., 2024). There is also a measurement uncertainty; e.g., at the Hyltemossa site, the high-frequency variability of EF throughout a sustained period of anomalously negative EF in July (Fig. S4b) contributed to shortening running window correlations and reducing the complete SM–T duration (Fig. S17).
Besides model resolution and parameterizations, the subgrid hierarchical structure of CTSM is a caveat for SM–T analysis in WRF-CTSM at the local scale. Soil moisture is defined at the soil column level within the vegetated land unit in the grid cell. Multiple PFTs share the same soil column and compete for the available soil water. Surface turbulent fluxes and 2 m temperature are, however, defined on the PFT level (Lawrence et al., 2020). Given the influence of the activities of co-existing PFTs sharing the same SM resource, tracking changes in all key coupling variables at the single PFT level is not straightforward. In addition to vegetation, among the land surface characteristics that affect coupling at the in situ level are elevation and soil texture, defined at the grid cell level in CTSM. Although disentangling the role of specific factors for SM–T strength lies beyond the framework of our study, the land surface characteristics of the investigated stations and their corresponding WRF-CTSM grid cells are summarized in Table S1. Elevation, dominant soil texture, and vegetation types are all represented well in the model at the 0.1° grid spacing for all stations except the Degerö site. This is because Degerö is a boreal mire covering 6.5 km2, making it a localized landscape feature surrounded by a pine forest (ICOS Sweden, 2025).
Selecting a single gridded dataset as the most suitable for representing SM–T is not straightforward, as insights about regional-scale patterns in our study primarily rely on a small number of available stations. In GLEAM-E-OBS (Fig. S18), the MJJA 2018 complete SM–T persists longer than at the stations (Fig. S17) or in WRF-CTSM runs (Figs. S19–S22). In contrast to the stations and Run 1, MJJA 2018 is not considered anomalous in GLEAM E-OBS, since the mean MJJA of other available years shows a similar persistence of complete coupling (Fig. S18). A high sensitivity to coupling in GLEAM-E-OBS is also depicted in the mean regional-scale complete coupling duration in MJJA 2010–2022 (excluding 2018), which is 56 d (not shown) as opposed to 32 d throughout the MJJA 2018 (Fig. 6a). One reason may be similar shapes of the key coupling variables over the years, following the seasonal climatology (Fig. S14). Accounting for all the stations, evaluation metrics, and key coupling variables, Run 4 stands out as the most aligned with the in situ observations (Tables S2 and S3). Run 4 incorporates additional parameterizations of the physical processes observed at the in situ scale during MJJA 2018. It includes compensatory root soil water uptake, which was observed even in shallow-rooted species, such as spruce, supported by hydraulic lift from below the rooting zone (Lindroth et al., 2020). Run 4 also reduces the direct impact of SM stress on vegetation (Fig. 9e), partly facilitated by leaf-level regulation of transpiration. It thus provides a more realistic representation of evaporation processes in this mid-to-high latitude environment. Further enhancements are, however, needed as plant water storage capacity and hydraulics are not an inherent part of the stomatal conductance parameterization (Jiménez-Rodríguez et al., 2024; Kennedy et al., 2019; Xu et al., 2023).
This study examines the extreme warm and dry conditions in southern and central Sweden during the MJJA 2018 period, where previous work demonstrated that SM–T amplified the heatwave intensity. Our analysis utilizes four WRF-CTSM simulations with varying setups based on recent CTSM developments (Runs 1–4). To complement the WRF-CTSM simulations, which are used here for the first time to analyze sustained warm and dry conditions, we also employ the GLEAM-E-OBS merged observational–reanalysis dataset, which provides all relevant variables at an analogous 0.1° grid spacing. The results of the two main study objectives, evaluating WRF-CTSM and GLEAM-E-OBS key coupling variables (SMSURF, EF, TMAX), and identifying the spatio-temporal extent of SM–T and its components during MJJA 2018, are addressed in the following.
Across all evaluation metrics, Runs 2–4 represent SMSURF well (against station observations and the ESA CCI satellite-based dataset), while GLEAM-EOBS shows a slight overall advantage. EF (based on LH and SH) from the stations is more closely aligned with Runs 2–4, and all datasets virtually reproduce local TMAX. The spatio-temporal extent of SM–T is assessed using a multi-correlation overlay approach based on 92 d running periods of combined negative TMAX:SMSURF, positive SMSURF:EF (terrestrial leg), and negative EF:TMAX (atmospheric leg) correlations under increasing TMAX. On average across the study region and all five datasets, TMAX:SMSURF persisted for 72 d, SMSURF:EF for 42 d, and EF:TMAX for 25 d during MJJA 2018, while the complete SM–T lasted for 22 d. Therefore, there is a strong but not definitive basis for determining the complete coupling duration based solely on analysing the number of days spent in the atmospheric leg (92 % of the complete coupling duration). The differences in SM–T duration among datasets are most pronounced at the local scale, as land surface characteristics and climatic conditions during the warm period are largely determined by grid spacing and utilized parameterizations. In contrast to GLEAM-E-OBS, WRF-CTSM captures the anomalousness of SM–T in MJJA 2018. Run 4 appears to represent the complete coupling most closely, although the exact timing and duration are difficult to replicate at local scales.
By combining observations and modelling, our study demonstrates the potential of WRF-CTSM for studying extended periods of warm and dry conditions, as it includes a detailed representation of physical processes. This work also highlights the value of the multi-correlation overlay approach in disentangling and examining the interplay between soil moisture and 2 m temperature. However, this analysis is limited to one case study. To ensure a more robust assessment, the same model and approach should be applied to additional events. Finally, these findings underscore the need to address inconsistencies in how SM–T variables and their interactions are represented and parameterized at the in situ scale.
The WRF-CTSM model output used in this study is openly available at https://doi.org/10.11582/2025.00057 (Mužić, 2025).
The supplement related to this article is available online at https://doi.org/10.5194/ascmo-11-273-2025-supplement.
IM designed the study, conducted simulations, curated the data, prepared figures, performed formal analysis, wrote the original draft, edited the paper, and coordinated the author team. ØH, YAY, TKB, and JS supervised the work and, along with DML and PAD, edited the paper.
The contact author has declared that none of the authors has any competing interests.
Publisher’s note: Copernicus Publications remains neutral with regard to jurisdictional claims made in the text, published maps, institutional affiliations, or any other geographical representation in this paper. While Copernicus Publications makes every effort to include appropriate place names, the final responsibility lies with the authors. Views expressed in the text are those of the authors and do not necessarily reflect the views of the publisher.
This article is part of the special issue “Advancing the statistical modelling of weather and climate extremes and their meteorological drivers based on moisture and heat transport”. It is not associated with a conference.
The authors thank Lisa Jach, Clemens Schwingshackl, Irene Brox Nilsen, Eleanor Blyth, and Nina Schuhen for their insights about coupling methodology and extreme event assessment. The acknowledgment is also extended to the E-OBS dataset from the Copernicus Climate Change Service (C3S, https://surfobs.climate.copernicus.eu, last access: 15 April 2025) and the data providers in the ECA&D project (https://www.ecad.eu, last access: 15 April 2025). Sigma2 – the National Infrastructure for High-Performance Computing and Data Storage in Norway (NN9188K) provided the computational resources used for this study.
This work received support from the Research Council of Norway (grant nos. 323321, 337168, and 294948) and is a contribution to the strategic research initiative LATICE (Faculty of Mathematics and Natural Sciences, University of Oslo, project no. UiO/GEO103920). JS is further supported by the German Research Foundation (DFG) under Germany's Excellence Strategy-EXC 2037: “CLICCS-Climate, Climatic Change, and Society” – project number: 390683824, contribution to the Center for Earth System Research and Sustainability (CEN) of the University of Hamburg.
This paper was edited by Luis Gimeno and reviewed by two anonymous referees.
Bakke, S. J., Ionita, M., and Tallaksen, L. M.: The 2018 northern European hydrological drought and its drivers in a historical perspective, Hydrol. Earth Syst. Sci., 24, 5621–5653, https://doi.org/10.5194/hess-24-5621-2020, 2020.
Barriopedro, D., García-Herrera, R., Ordóñez, C., Miralles, D. G., and Salcedo-Sanz, S.: Heat Waves: Physical Understanding and Scientific Challenges, Reviews of Geophysics, 61, e2022RG000780, https://doi.org/10.1029/2022RG000780, 2023.
Bastos, A., Ciais, P., Friedlingstein, P., Sitch, S., Pongratz, J., Fan, L., Wigneron, J. P., Weber, U., Reichstein, M., Fu, Z., Anthoni, P., Arneth, A., Haverd, V., Jain, A. K., Joetzjer, E., Knauer, J., Lienert, S., Loughran, T., McGuire, P. C., Tian, H., Viovy, N., and Zaehle, S.: Direct and seasonal legacy effects of the 2018 heat wave and drought on European ecosystem productivity, Science Advances, 6, eaba2724, https://doi.org/10.1126/sciadv.aba2724, 2020.
Calvin, K., Dasgupta, D., Krinner, G., Mukherji, A., Thorne, P. W., Trisos, C., Romero, J., Aldunce, P., Barrett, K., Blanco, G., Cheung, W. W. L., Connors, S., Denton, F., Diongue-Niang, A., Dodman, D., Garschagen, M., Geden, O., Hayward, B., Jones, C., Jotzo, F., Krug, T., Lasco, R., Lee, Y.-Y., Masson-Delmotte, V., Meinshausen, M., Mintenbeck, K., Mokssit, A., Otto, F. E. L., Pathak, M., Pirani, A., Poloczanska, E., Pörtner, H.-O., Revi, A., Roberts, D. C., Roy, J., Ruane, A. C., Skea, J., Shukla, P. R., Slade, R., Slangen, A., Sokona, Y., Sörensson, A. A., Tignor, M., Van Vuuren, D., Wei, Y.-M., Winkler, H., Zhai, P., Zommers, Z., Hourcade, J.-C., Johnson, F. X., Pachauri, S., Simpson, N. P., Singh, C., Thomas, A., Totin, E., Arias, P., Bustamante, M., Elgizouli, I., Flato, G., Howden, M., Méndez-Vallejo, C., Pereira, J. J., Pichs-Madruga, R., Rose, S. K., Saheb, Y., Sánchez Rodríguez, R., Ürge-Vorsatz, D., Xiao, C., Yassaa, N., Alegría, A., Armour, K., Bednar-Friedl, B., Blok, K., Cissé, G., Dentener, F., Eriksen, S., Fischer, E., Garner, G., Guivarch, C., Haasnoot, M., Hansen, G., Hauser, M., Hawkins, E., Hermans, T., Kopp, R., Leprince-Ringuet, N., Lewis, J., Ley, D., Ludden, C., Niamir, L., Nicholls, Z., Some, S., Szopa, S., Trewin, B., Van Der Wijst, K.-I., Winter, G., Witting, M., Birt, A., Ha, M.: IPCC, 2023: Climate Change 2023: Synthesis Report. Contribution of Working Groups I, II and III to the Sixth Assessment Report of the Intergovernmental Panel on Climate Change, edited by: Core Writing Team, Lee, H. and Romero, J., IPCC, Geneva, Switzerland, Intergovernmental Panel on Climate Change (IPCC), https://doi.org/10.59327/IPCC/AR6-9789291691647, 2023.
Copernicus Climate Change Service (C3S): https://climate.copernicus.eu/dry-and-warm-spring-and-summer, last access: 1 August 2024.
Cornes, R. C., Van Der Schrier, G., Van Den Besselaar, E. J. M., and Jones, P. D.: An Ensemble Version of the E-OBS Temperature and Precipitation Data Sets, J. Geophys. Res. Atmos., 123, 9391–9409, https://doi.org/10.1029/2017JD028200, 2018.
Dagon, K., Sanderson, B. M., Fisher, R. A., and Lawrence, D. M.: A machine learning approach to emulation and biophysical parameter estimation with the Community Land Model, version 5, Advances in Statistical Climatology, Meteorology and Oceanography, 6, 223–244, https://doi.org/10.5194/ascmo-6-223-2020, 2020.
Denissen, J. M. C., Teuling, A. J., Pitman, A. J., Koirala, S., Migliavacca, M., Li, W., Reichstein, M., Winkler, A. J., Zhan, C., and Orth, R.: Widespread shift from ecosystem energy to water limitation with climate change, Nat. Clim. Chang., 12, 677–684, https://doi.org/10.1038/s41558-022-01403-8, 2022.
Dirmeyer, P. A.: The terrestrial segment of soil moisture–climate coupling, Geophysical Research Letters, 38, https://doi.org/10.1029/2011GL048268, 2011.
Dirmeyer, P. A., Schlosser, C. A., and Brubaker, K. L.: Precipitation, Recycling, and Land Memory: An Integrated Analysis, Journal of Hydrometeorology, 10, 278–288, https://doi.org/10.1175/2008JHM1016.1, 2009.
Dirmeyer, P. A., Balsamo, G., Blyth, E., Morrison, R., and Cooper, H. M.: Land-Atmosphere Interactions Exacerbated the Drought and Heatwave over Northern Europe during Summer 2018, AGU Advances, 2, e2020AV000283, https://doi.org/10.1029/2020AV000283, 2021.
Dorigo, W., Wagner, W., Albergel, C., Albrecht, F., Balsamo, G., Brocca, L., Chung, D., Ertl, M., Forkel, M., Gruber, A., Haas, E., Hamer, P. D., Hirschi, M., Ikonen, J., de Jeu, R., Kidd, R., Lahoz, W., Liu, Y. Y., Miralles, D., Mistelbauer, T., Nicolai-Shaw, N., Parinussa, R., Pratola, C., Reimer, C., van der Schalie, R., Seneviratne, S. I., Smolander, T., and Lecomte, P.: ESA CCI Soil Moisture for improved Earth system understanding: State-of-the art and future directions, Remote Sensing of Environment, 203, 185–215, https://doi.org/10.1016/j.rse.2017.07.001, 2017.
Drought 2018 Team and ICOS Ecosystem Thematic Centre: Drought-2018 ecosystem eddy covariance flux product for 52 stations in FLUXNET-Archive format, https://doi.org/10.18160/YVR0-4898, 2020.
Findell, K. L., Gentine, P., Lintner, B. R., and Guillod, B. P.: Data Length Requirements for Observational Estimates of Land–Atmosphere Coupling Strength, Journal of Hydrometeorology, 16, 1615–1635, https://doi.org/10.1175/JHM-D-14-0131.1, 2015.
Findell, K. L., Yin, Z., Seo, E., Dirmeyer, P. A., Arnold, N. P., Chaney, N., Fowler, M. D., Huang, M., Lawrence, D. M., Ma, P.-L., and Santanello Jr., J. A.: Accurate assessment of land–atmosphere coupling in climate models requires high-frequency data output, Geosci. Model Dev., 17, 1869–1883, https://doi.org/10.5194/gmd-17-1869-2024, 2024.
Fu, Z., Ciais, P., Prentice, I. C., Gentine, P., Makowski, D., Bastos, A., Luo, X., Green, J. K., Stoy, P. C., Yang, H., and Hajima, T.: Atmospheric dryness reduces photosynthesis along a large range of soil water deficits, Nat. Commun., 13, 989, https://doi.org/10.1038/s41467-022-28652-7, 2022.
Fu, Z., Ciais, P., Wigneron, J.-P., Gentine, P., Feldman, A. F., Makowski, D., Viovy, N., Kemanian, A. R., Goll, D. S., Stoy, P. C., Prentice, I. C., Yakir, D., Liu, L., Ma, H., Li, X., Huang, Y., Yu, K., Zhu, P., Li, X., Zhu, Z., Lian, J., and Smith, W. K.: Global critical soil moisture thresholds of plant water stress, Nat. Commun., 15, 4826, https://doi.org/10.1038/s41467-024-49244-7, 2024.
Gao, X., Avramov, A., Saikawa, E., and Schlosser, C. A.: Emulation of Community Land Model Version 5 (CLM5) to Quantify Sensitivity of Soil Moisture to Uncertain Parameters, Journal of Hydrometeorology, 22, 259–278, https://doi.org/10.1175/JHM-D-20-0043.1, 2021.
Gevaert, A. I., Miralles, D. G., de Jeu, R. a. M., Schellekens, J., and Dolman, A. J.: Soil Moisture-Temperature Coupling in a Set of Land Surface Models, Journal of Geophysical Research: Atmospheres, 123, 1481–1498, https://doi.org/10.1002/2017JD027346, 2018.
Grossiord, C., Buckley, T. N., Cernusak, L. A., Novick, K. A., Poulter, B., Siegwolf, R. T. W., Sperry, J. S., and McDowell, N. G.: Plant responses to rising vapor pressure deficit, New Phytologist, 226, 1550–1566, https://doi.org/10.1111/nph.16485, 2020.
Gruber, A., Scanlon, T., van der Schalie, R., Wagner, W., and Dorigo, W.: Evolution of the ESA CCI Soil Moisture climate data records and their underlying merging methodology, Earth Syst. Sci. Data, 11, 717–739, https://doi.org/10.5194/essd-11-717-2019, 2019.
Hersbach, H., Bell, B., Berrisford, P., Hirahara, S., Horányi, A., Muñoz-Sabater, J., Nicolas, J., Peubey, C., Radu, R., Schepers, D., Simmons, A., Soci, C., Abdalla, S., Abellan, X., Balsamo, G., Bechtold, P., Biavati, G., Bidlot, J., Bonavita, M., De Chiara, G., Dahlgren, P., Dee, D., Diamantakis, M., Dragani, R., Flemming, J., Forbes, R., Fuentes, M., Geer, A., Haimberger, L., Healy, S., Hogan, R. J., Hólm, E., Janisková, M., Keeley, S., Laloyaux, P., Lopez, P., Lupu, C., Radnoti, G., de Rosnay, P., Rozum, I., Vamborg, F., Villaume, S., and Thépaut, J.-N.: The ERA5 global reanalysis, Quarterly Journal of the Royal Meteorological Society, 146, 1999–2049, https://doi.org/10.1002/qj.3803, 2020.
Hong, S.-Y. and Lim, J.-O. J.: The WRF Single-Moment 6-Class Microphysics Scheme (WSM6), Journal of the Korean Meteorological Society, 42, 129–151, 2006.
Hong, S.-Y., Noh, Y., and Dudhia, J.: A New Vertical Diffusion Package with an Explicit Treatment of Entrainment Processes, Monthly Weather Review, 134, 2318–2341, https://doi.org/10.1175/MWR3199.1, 2006.
Hoy, A., Hänsel, S., and Maugeri, M.: An endless summer: 2018 heat episodes in Europe in the context of secular temperature variability and change, International Journal of Climatology, 40, 6315–6336, https://doi.org/10.1002/joc.6582, 2020.
Hsu, H. and Dirmeyer, P. A.: Deconstructing the Soil Moisture–Latent Heat Flux Relationship: The Range of Coupling Regimes Experienced and the Presence of Nonlinearity within the Sensitive Regime, Journal of Hydrometeorology, 23, 1041–1057, https://doi.org/10.1175/JHM-D-21-0224.1, 2022.
Hsu, H. and Dirmeyer, P. A.: Soil moisture-evaporation coupling shifts into new gears under increasing CO2, Nat. Commun., 14, 1162, https://doi.org/10.1038/s41467-023-36794-5, 2023a.
Hsu, H. and Dirmeyer, P. A.: Uncertainty in Projected Critical Soil Moisture Values in CMIP6 Affects the Interpretation of a More Moisture-Limited World, Earth's Future, 11, e2023EF003511, https://doi.org/10.1029/2023EF003511, 2023b.
Hulsman, P., Keune, J., Koppa, A., Schellekens, J., and Miralles, D. G.: Incorporating Plant Access to Groundwater in Existing Global, Satellite-Based Evaporation Estimates, Water Resources Research, 59, e2022WR033731, https://doi.org/10.1029/2022WR033731, 2023.
Iacono, M. J., Delamere, J. S., Mlawer, E. J., Shephard, M. W., Clough, S. A., and Collins, W. D.: Radiative forcing by long-lived greenhouse gases: Calculations with the AER radiative transfer models, Journal of Geophysical Research: Atmospheres, 113, https://doi.org/10.1029/2008JD009944, 2008.
ICOS Sweden: https://www.icos-sweden.se/, last access: 26 February 2025.
Jiménez-Rodríguez, C. D., Fabiani, G., Schoppach, R., Mallick, K., Schymanski, S. J., and Sulis, M.: Detecting Vegetation Stress in Mixed Forest Ecosystems Through the Joint Use of Tree-Water Monitoring and Land Surface Modeling, Water Resources Research, 60, e2024WR037194, https://doi.org/10.1029/2024WR037194, 2024.
Kain, J. S.: The Kain–Fritsch Convective Parameterization: An Update, Journal of Applied Meteorology and Climatology, 43, 170–181, https://doi.org/10.1175/1520-0450(2004)043<0170:TKCPAU>2.0.CO;2, 2004.
Kennedy, D., Swenson, S., Oleson, K. W., Lawrence, D. M., Fisher, R., Lola da Costa, A. C., and Gentine, P.: Implementing Plant Hydraulics in the Community Land Model, Version 5, Journal of Advances in Modeling Earth Systems, 11, 485–513, https://doi.org/10.1029/2018MS001500, 2019.
Knist, S., Goergen, K., Buonomo, E., Christensen, O. B., Colette, A., Cardoso, R. M., Fealy, R., Fernández, J., García-Díez, M., Jacob, D., Kartsios, S., Katragkou, E., Keuler, K., Mayer, S., van Meijgaard, E., Nikulin, G., Soares, P. M. M., Sobolowski, S., Szepszo, G., Teichmann, C., Vautard, R., Warrach-Sagi, K., Wulfmeyer, V., and Simmer, C.: Land-atmosphere coupling in EURO-CORDEX evaluation experiments, Journal of Geophysical Research: Atmospheres, 122, 79–103, https://doi.org/10.1002/2016JD025476, 2017.
Koppa, A., Rains, D., Hulsman, P., Poyatos, R., and Miralles, D. G.: A deep learning-based hybrid model of global terrestrial evaporation, Nat. Commun., 13, 1912, https://doi.org/10.1038/s41467-022-29543-7, 2022.
Koster, R. D., Schubert, S. D., and Suarez, M. J.: Analyzing the Concurrence of Meteorological Droughts and Warm Periods, with Implications for the Determination of Evaporative Regime, Journal of Climate, 22, 3331–3341, https://doi.org/10.1175/2008JCLI2718.1, 2009.
Kueh, M.-T. and Lin, C.-Y.: The 2018 summer heatwaves over northwestern Europe and its extended-range prediction, Sci. Rep., 10, 19283, https://doi.org/10.1038/s41598-020-76181-4, 2020.
Lawrence, D. M., Fisher, R. A., Koven, C. D., Oleson, K. W., Swenson, S. C., Bonan, G., Collier, N., Ghimire, B., Kampenhout, L., Kennedy, D., Kluzek, E., Lawrence, P. J., Li, F., Li, H., Lombardozzi, D., Riley, W. J., Sacks, W. J., Shi, M., Vertenstein, M., Wieder, W. R., Xu, C., Ali, A. A., Badger, A. M., Bisht, G., Broeke, M., Brunke, M. A., Burns, S. P., Buzan, J., Clark, M., Craig, A., Dahlin, K., Drewniak, B., Fisher, J. B., Flanner, M., Fox, A. M., Gentine, P., Hoffman, F., Keppel-Aleks, G., Knox, R., Kumar, S., Lenaerts, J., Leung, L. R., Lipscomb, W. H., Lu, Y., Pandey, A., Pelletier, J. D., Perket, J., Randerson, J. T., Ricciuto, D. M., Sanderson, B. M., Slater, A., Subin, Z. M., Tang, J., Thomas, R. Q., Val Martin, M., and Zeng, X.: The Community Land Model Version 5: Description of New Features, Benchmarking, and Impact of Forcing Uncertainty, J. Adv. Model. Earth Syst., 11, 4245–4287, https://doi.org/10.1029/2018MS001583, 2019.
Lawrence, D. M., Fisher, R., Koven, C., Oleson, K., Swenson, S., and Verteinstein, M.: CLM5 Documentation, The National Center for Atmospheric Research (NCAR), Boulder, Colorado, https://www.cesm.ucar.edu/models/clm/docs (last access: 1 November 2024), 2020.
Li, M., Wu, P., and Ma, Z.: A comprehensive evaluation of soil moisture and soil temperature from third-generation atmospheric and land reanalysis data sets, International Journal of Climatology, 40, 5744–5766, https://doi.org/10.1002/joc.6549, 2020.
Lindroth, A., Holst, J., Linderson, M.-L., Aurela, M., Biermann, T., Heliasz, M., Chi, J., Ibrom, A., Kolari, P., Klemedtsson, L., Krasnova, A., Laurila, T., Lehner, I., Lohila, A., Mammarella, I., Mölder, M., Löfvenius, M. O., Peichl, M., Pilegaard, K., Soosaar, K., Vesala, T., Vestin, P., Weslien, P., and Nilsson, M.: Effects of drought and meteorological forcing on carbon and water fluxes in Nordic forests during the dry summer of 2018, Phil. Trans. R. Soc. B, 375, 20190516, https://doi.org/10.1098/rstb.2019.0516, 2020.
Maraun, D., Schiemann, R., Ossó, A., and Jury, M.: Changes in event soil moisture-temperature coupling can intensify very extreme heat beyond expectations, Nat. Commun., 16, 734, https://doi.org/10.1038/s41467-025-56109-0, 2025.
Medlyn, B. E., Duursma, R. A., Eamus, D., Ellsworth, D. S., Prentice, I. C., Barton, C. V. M., Crous, K. Y., De Angelis, P., Freeman, M., and Wingate, L.: Reconciling the optimal and empirical approaches to modelling stomatal conductance, Global Change Biology, 17, 2134–2144, https://doi.org/10.1111/j.1365-2486.2010.02375.x, 2011.
Meier, R., Davin, E. L., Swenson, S. C., Lawrence, D. M., and Schwaab, J.: Biomass heat storage dampens diurnal temperature variations in forests, Environ. Res. Lett., 14, 084026, https://doi.org/10.1088/1748-9326/ab2b4e, 2019.
Miralles, D. G., Holmes, T. R. H., De Jeu, R. A. M., Gash, J. H., Meesters, A. G. C. A., and Dolman, A. J.: Global land-surface evaporation estimated from satellite-based observations, Hydrol. Earth Syst. Sci., 15, 453–469, https://doi.org/10.5194/hess-15-453-2011, 2011.
Miralles, D. G., Gentine, P., Seneviratne, S. I., and Teuling, A. J.: Land–atmospheric feedbacks during droughts and heatwaves: state of the science and current challenges, Annals of the New York Academy of Sciences, 1436, 19–35, https://doi.org/10.1111/nyas.13912, 2019.
Miralles, D. G., Brutsaert, W., Dolman, A. J., and Gash, J. H.: On the Use of the Term “Evapotranspiration”, Water Resources Research, 56, e2020WR028055, https://doi.org/10.1029/2020WR028055, 2020.
Miralles, D. G., Bonte, O., Koppa, A., Baez-Villanueva, O. M., Tronquo, E., Zhong, F., Beck, H. E., Hulsman, P., Dorigo, W., Verhoest, N. E. C., and Haghdoost, S.: GLEAM4: global land evaporation and soil moisture dataset at 0.1° resolution from 1980 to near present, Sci. Data, 12, 416, https://doi.org/10.1038/s41597-025-04610-y, 2025.
Mužić, I.: WRF-CTSM model output for “Soil Moisture–Temperature Coupling During a 2018 Heatwave in Sweden: A Case Study with WRF-CTSM”, sigma2 [data set], https://doi.org/10.11582/2025.00057, 2025.
Mužić, I., Hodnebrog, Ø., Yilmaz, Y. A., Berntsen, T. K., Lawrence, D. M., and Sobhani, N.: The Evaluation of Hydroclimatic Variables Over Nordic Fennoscandia Using WRF-CTSM, Journal of Geophysical Research: Atmospheres, 130, e2024JD043103, https://doi.org/10.1029/2024JD043103, 2025.
Pastorello, G., Trotta, C., Canfora, E., Chu, H., Christianson, D., Cheah, Y.-W., Poindexter, C., Chen, J., Elbashandy, A., Humphrey, M., Isaac, P., Polidori, D., Reichstein, M., Ribeca, A., van Ingen, C., Vuichard, N., Zhang, L., Amiro, B., Ammann, C., Arain, M. A., Ardö, J., Arkebauer, T., Arndt, S. K., Arriga, N., Aubinet, M., Aurela, M., Baldocchi, D., Barr, A., Beamesderfer, E., Marchesini, L. B., Bergeron, O., Beringer, J., Bernhofer, C., Berveiller, D., Billesbach, D., Black, T. A., Blanken, P. D., Bohrer, G., Boike, J., Bolstad, P. V., Bonal, D., Bonnefond, J.-M., Bowling, D. R., Bracho, R., Brodeur, J., Brümmer, C., Buchmann, N., Burban, B., Burns, S. P., Buysse, P., Cale, P., Cavagna, M., Cellier, P., Chen, S., Chini, I., Christensen, T. R., Cleverly, J., Collalti, A., Consalvo, C., Cook, B. D., Cook, D., Coursolle, C., Cremonese, E., Curtis, P. S., D'Andrea, E., da Rocha, H., Dai, X., Davis, K. J., Cinti, B. D., Grandcourt, A. de, Ligne, A. D., De Oliveira, R. C., Delpierre, N., Desai, A. R., Di Bella, C. M., Tommasi, P. di, Dolman, H., Domingo, F., Dong, G., Dore, S., Duce, P., Dufrêne, E., Dunn, A., Dušek, J., Eamus, D., Eichelmann, U., ElKhidir, H. A. M., Eugster, W., Ewenz, C. M., Ewers, B., Famulari, D., Fares, S., Feigenwinter, I., Feitz, A., Fensholt, R., Filippa, G., Fischer, M., Frank, J., Galvagno, M.: The FLUXNET2015 dataset and the ONEFlux processing pipeline for eddy covariance data, Scientific Data, 7, 225, https://doi.org/10.1038/s41597-020-0534-3, 2020.
Petch, J. C., Short, C. J., Best, M. J., McCarthy, M., Lewis, H. W., Vosper, S. B., and Weeks, M.: Sensitivity of the 2018 UK summer heatwave to local sea temperatures and soil moisture, Atmospheric Science Letters, 21, e948, https://doi.org/10.1002/asl.948, 2020.
Peters, W., Bastos, A., Ciais, P., and Vermeulen, A.: A historical, geographical and ecological perspective on the 2018 European summer drought, Philosophical Transactions of the Royal Society B: Biological Sciences, 375, 20190505, https://doi.org/10.1098/rstb.2019.0505, 2020.
Preimesberger, W., Scanlon, T., Su, C.-H., Gruber, A., and Dorigo, W.: Homogenization of Structural Breaks in the Global ESA CCI Soil Moisture Multisatellite Climate Data Record, IEEE Transactions on Geoscience and Remote Sensing, 59, 2845–2862, https://doi.org/10.1109/TGRS.2020.3012896, 2021.
Qiao, L., Zuo, Z., Zhang, R., Piao, S., Xiao, D., and Zhang, K.: Soil moisture–atmosphere coupling accelerates global warming, Nat. Commun., 14, 4908, https://doi.org/10.1038/s41467-023-40641-y, 2023.
Qiu, J., Crow, W. T., Dong, J., and Nearing, G. S.: Model representation of the coupling between evapotranspiration and soil water content at different depths, Hydrol. Earth Syst. Sci., 24, 581–594, https://doi.org/10.5194/hess-24-581-2020, 2020.
Rousi, E., Fink, A. H., Andersen, L. S., Becker, F. N., Beobide-Arsuaga, G., Breil, M., Cozzi, G., Heinke, J., Jach, L., Niermann, D., Petrovic, D., Richling, A., Riebold, J., Steidl, S., Suarez-Gutierrez, L., Tradowsky, J. S., Coumou, D., Düsterhus, A., Ellsäßer, F., Fragkoulidis, G., Gliksman, D., Handorf, D., Haustein, K., Kornhuber, K., Kunstmann, H., Pinto, J. G., Warrach-Sagi, K., and Xoplaki, E.: The extremely hot and dry 2018 summer in central and northern Europe from a multi-faceted weather and climate perspective, Nat. Hazards Earth Syst. Sci., 23, 1699–1718, https://doi.org/10.5194/nhess-23-1699-2023, 2023.
Salomón, R. L., Peters, R. L., Zweifel, R., Sass-Klaassen, U. G. W., Stegehuis, A. I., Smiljanic, M., Poyatos, R., Babst, F., Cienciala, E., Fonti, P., Lerink, B. J. W., Lindner, M., Martinez-Vilalta, J., Mencuccini, M., Nabuurs, G.-J., van der Maaten, E., von Arx, G., Bär, A., Akhmetzyanov, L., Balanzategui, D., Bellan, M., Bendix, J., Berveiller, D., Blaženec, M., Èada, V., Carraro, V., Cecchini, S., Chan, T., Conedera, M., Delpierre, N., Delzon, S., Ditmarová, Ľ., Dolezal, J., Dufrêne, E., Edvardsson, J., Ehekircher, S., Forner, A., Frouz, J., Ganthaler, A., Gryc, V., Güney, A., Heinrich, I., Hentschel, R., Janda, P., Ježík, M., Kahle, H.-P., Knüsel, S., Krejza, J., Kuberski, £., Kuèera, J., Lebourgeois, F., Mikoláš, M., Matula, R., Mayr, S., Oberhuber, W., Obojes, N., Osborne, B., Paljakka, T., Plichta, R., Rabbel, I., Rathgeber, C. B. K., Salmon, Y., Saunders, M., Scharnweber, T., Sitková, Z., Stangler, D. F., Stereñczak, K., Stojanoviæ, M., Støelcová, K., Svìtlík, J., Svoboda, M., Tobin, B., Trotsiuk, V., Urban, J., Valladares, F., Vavrèík, H., Vejpustková, M., Walthert, L., Wilmking, M., Zin, E., Zou, J., and Steppe, K.: The 2018 European heatwave led to stem dehydration but not to consistent growth reductions in forests, Nat. Commun., 13, 28, https://doi.org/10.1038/s41467-021-27579-9, 2022.
Schönbeck, L. C., Schuler, P., Lehmann, M. M., Mas, E., Mekarni, L., Pivovaroff, A. L., Turberg, P., and Grossiord, C.: Increasing temperature and vapour pressure deficit lead to hydraulic damages in the absence of soil drought, Plant Cell Environ., 45, 3275–3289, https://doi.org/10.1111/pce.14425, 2022.
Schwingshackl, C., Hirschi, M., and Seneviratne, S. I.: Quantifying Spatiotemporal Variations of Soil Moisture Control on Surface Energy Balance and Near-Surface Air Temperature, Journal of Climate, 30, 7105–7124, https://doi.org/10.1175/JCLI-D-16-0727.1, 2017.
Schwitalla, T., Jach, L., Wulfmeyer, V., and Warrach-Sagi, K.: Soil moisture–atmosphere coupling strength over central Europe in the recent warming climate, Nat. Hazards Earth Syst. Sci., 25, 1405–1424, https://doi.org/10.5194/nhess-25-1405-2025, 2025.
Seneviratne, S. I., Corti, T., Davin, E. L., Hirschi, M., Jaeger, E. B., Lehner, I., Orlowsky, B., and Teuling, A. J.: Investigating soil moisture–climate interactions in a changing climate: A review, Earth-Science Reviews, 99, 125–161, https://doi.org/10.1016/j.earscirev.2010.02.004, 2010.
Shuttleworth, W., Gurney, R., Hsu, A., and Ormsby, J.: FIFE: the variation in energy partition at surface flux sites, Remote Sens. Large-Scale Glob. Porc. (IAHS Publ.), 186, 67–74, 1989.
Sjökvist, E., Abdoush, D., and Axén, J.: Sommaren 2018 – en glimt av framtiden?, SMHI, https://www.smhi.se/download/18.18f5a56618fc9f08e832d106/1717805236853/Klimatologi_52 Sommaren 2018 - en glimt av framtiden.pdf (last access: 12 December 2024), 2019.
Skamarock, C., Klemp, B., Dudhia, J., Gill, O., Liu, Z., Berner, J., Wang, W., Powers, G., Duda, G., Barker, D., and Huang, X.: A Description of the Advanced Research WRF Model Version 4.3, National Center for Atmospheric Research (NCAR), https://opensky.ucar.edu/islandora/object/technotes:588/ (last access: 14 February 2025), 2021.
Sulman, B. N., Roman, D. T., Yi, K., Wang, L., Phillips, R. P., and Novick, K. A.: High atmospheric demand for water can limit forest carbon uptake and transpiration as severely as dry soil, Geophysical Research Letters, 43, 9686–9695, https://doi.org/10.1002/2016GL069416, 2016.
Tak, S., Seo, E., Dirmeyer, P. A., and Lee, M.-I.: The role of soil moisture-temperature coupling for the 2018 Northern European heatwave in a subseasonal forecast, Weather and Climate Extremes, 44, 100670, https://doi.org/10.1016/j.wace.2024.100670, 2024.
UCAR: Using CTSM with WRF — CTSM documentation: https://escomp.github.io/ctsm-docs/versions/master/html/lilac/specific-atm-models/wrf.html, last access: 20 February 2021.
Ukkola, A. M., Pitman, A. J., Donat, M. G., De Kauwe, M. G., and Angélil, O.: Evaluating the Contribution of Land-Atmosphere Coupling to Heat Extremes in CMIP5 Models, Geophysical Research Letters, 45, 9003–9012, https://doi.org/10.1029/2018GL079102, 2018.
Wang, C., Qian, Y., Duan, Q., Huang, M., Yang, Z., Berg, L. K., Gustafson, W. I., Feng, Z., Liu, J., and Quan, J.: Quantifying physical parameterization uncertainties associated with land-atmosphere interactions in the WRF model over Amazon, Atmospheric Research, 262, 105761, https://doi.org/10.1016/j.atmosres.2021.105761, 2021a.
Wang, P., Li, D., Liao, W., Rigden, A., and Wang, W.: Contrasting Evaporative Responses of Ecosystems to Heatwaves Traced to the Opposing Roles of Vapor Pressure Deficit and Surface Resistance, Water Resources Research, 55, 4550–4563, https://doi.org/10.1029/2019WR024771, 2019.
Wang, Y., Li, R., Hu, J., Fu, Y., Duan, J., Cheng, Y., and Song, B.: Understanding the Non-Linear Response of Summer Evapotranspiration to Clouds in a Temperate Forest Under the Impact of Vegetation Water Content, Journal of Geophysical Research: Atmospheres, 126, e2021JD035239, https://doi.org/10.1029/2021JD035239, 2021b.
Warm Winter 2020 Team and ICOS Ecosystem Thematic Centre: Warm Winter 2020 ecosystem eddy covariance flux product for 73 stations in FLUXNET-Archive format – release 2022-1 (Version 1.0), https://doi.org/10.18160/2G60-ZHAK, 2022.
Wilcke, R. A. I., Kjellström, E., Lin, C., Matei, D., Moberg, A., and Tyrlis, E.: The extremely warm summer of 2018 in Sweden – set in a historical context, Earth Syst. Dynam., 11, 1107–1121, https://doi.org/10.5194/esd-11-1107-2020, 2020.
Xu, C., Christoffersen, B., Robbins, Z., Knox, R., Fisher, R. A., Chitra-Tarak, R., Slot, M., Solander, K., Kueppers, L., Koven, C., and McDowell, N.: Quantification of hydraulic trait control on plant hydrodynamics and risk of hydraulic failure within a demographic structured vegetation model in a tropical forest (FATES–HYDRO V1.0), Geosci. Model Dev., 16, 6267–6283, https://doi.org/10.5194/gmd-16-6267-2023, 2023.
Yuan, R., Li, F., and Ye, R.: Global diagnosis of land–atmosphere coupling based on water isotopes, Sci. Rep., 13, 21319, https://doi.org/10.1038/s41598-023-48694-1, 2023.
Zarakas, C. M., Kennedy, D., Dagon, K., Lawrence, D. M., Liu, A., Bonan, G., Koven, C., Lombardozzi, D., and Swann, A. L. S.: Land Processes Can Substantially Impact the Mean Climate State, Geophysical Research Letters, 51, e2024GL108372, https://doi.org/10.1029/2024GL108372, 2024.
Zhong, F., Jiang, S., van Dijk, A. I. J. M., Ren, L., Schellekens, J., and Miralles, D. G.: Revisiting large-scale interception patterns constrained by a synthesis of global experimental data, Hydrol. Earth Syst. Sci., 26, 5647–5667, https://doi.org/10.5194/hess-26-5647-2022, 2022.