the Creative Commons Attribution 4.0 License.
the Creative Commons Attribution 4.0 License.
 | 14 Mar 2025
Analysis of meteorological drought using satellite-based rainfall products over southern Ethiopia
Tesfay Mekonnen Weldegerima
Tewelde Berihu Gebresilassie
Drought is one of the recurring natural phenomena affecting the socio-economic and environmental well-being of southern Ethiopia's society. The availability of insufficient ground-based rainfall observatory networks is limiting drought-monitoring and early-warning investigations. The main objective of this study is to analyze spatial and temporal drought characteristics using high-resolution satellite-based rainfall products for the 1991–2022 period in the Southern Nations, Nationalities, and Peoples (SNNP) region of Ethiopia. The satellite-based rainfall product used in this study was selected after the evaluation of three satellite products, namely the Africa Rainfall Climatology version 2 (ARC2), the Climate Hazards Group InfraRed Precipitation with Stations (CHIRPS), and the Tropical Applications of Meteorology using SATellite and ground-based observations (TAMSAT), against station-based rainfall for the study area space and time domains. The statistical metrics of correlation coefficient (CORR), bias (BIAS), percent bias (PBIAS), mean error (ME), mean absolute error (MAE), root mean square error (RMSE), and Nash–Sutcliffe efficiency coefficient (NSE) were used to compare and evaluate the satellite rainfall products. Accordingly, the CHIRPS shows the highest CORR of 0.96 and the highest BIAS of 1.02, which is very near to the perfect value (BIAS = 1), followed by the TAMSAT. Hence, the CHIRPS-based satellite rainfall product was used to assess the spatio-temporal patterns of meteorological drought based on the 3-month and 12-month standardized precipitation index (SPI). The results successfully grasped the known historical and recent droughts of 2022, 2021, 2015, 2014, 2010, 2009, and 2000. A high intensity and a high severity of drought were noted in the SPI-3, while the least occurrences of extreme events were recorded in the SPI-12. Additionally, severe drought situations were detected in the drought-prone areas in the southern and southeastern parts of the SNNP region. Finally, the study concludes that, to construct grid-based drought-monitoring tools for the development of early-warning systems, the CHIRPS rainfall product can be used as an additional source of information.
- Article
(1891 KB) - Full-text XML
- BibTeX
- EndNote


Drought is one of the most hazardous climate extremes that affects different parts of the planet annually. It has a wide range of effects, results in significant financial losses, and endangers both human life and the environment (Olagunju, 2015; Vicente-Serrano et al., 2020; Wilhite and Buchanan-Smith, 2005). A significant section of Ethiopia's population has been harmed by frequent, protracted drought occurrences that have damaged crops and killed livestock. In recent decades, the country has experienced severe and unprecedented drought episodes (Bayissa et al., 2019; Degefu and Bewket, 2015; Mekonen et al., 2020). A few of the big droughts that affected most of the nation were those that occurred in 2014–2015, 2009–2010, 1994–1995, and 1983–1984, among others (Ayugi et al., 2022; Mera, 2018; Viste et al., 2013). The 1983–1984 drought was one of the worst in Ethiopian history, affecting almost 35 million people or 22 % of the country's entire population at that time according to figures from historical studies on drought. The agriculture sector is impacted by drought since it depends on regular and sufficient seasonal rainfall. In Ethiopia, the income from agricultural production supports almost 85 % of the population (Gezie, 2019; Yigezu, 2021). However, the farming methods are quite archaic and mostly rain-fed (Hordofa et al., 2008; Moges and Bhat, 2021). Furthermore, a high degree of spatial and temporal variability in rainfall results in a large degree of fluctuation in the amount of water available for crops at the root zone (Brocca et al., 2010; Wilson et al., 2004). To diminish the negative effects of drought on the country, early-warning systems and drought monitoring are essential (Boken et al., 2005).
Drought indices, which quantify the shortfall of hydrologic-cycle components relative to the long-term mean, are often widely applied in drought monitoring (Ntale and Gan, 2003; Paulo and Pereira, 2006; Salimi et al., 2021; Zargar et al., 2011). The climatological mean serves as a benchmark for calculating an event's variance. Consequently, the degree of dryness – or the departure from the typical or average amount of rainfall over an extended period – is what is used to characterize meteorological drought (Quiring, 2009). Hydrological drought, on the other hand, is the absence of certain hydrological-water-cycle components, such as river flow, groundwater flow, and reservoir storage, and is caused by a lack of certain meteorological parameters, primarily rainfall (Van Loon, 2015). Similarly, agricultural drought is commonly characterized as the lack of readily available water for plants to use to meet their water demands (Liu et al., 2016; Wilhelmi and Wilhite, 2002; Wilhite and Buchanan-Smith, 2005). Before affecting agricultural and hydrological water components, meteorological drought can be considered to be an early indication of drought (Han et al., 2023).
The availability of rainfall data at appropriate spatial and temporal scales is a prerequisite for the drought-monitoring system. However, one of the major challenges, particularly for emerging countries like Ethiopia, is to obtain from meteorological observation stations reliable climatic records on rainfall that are balanced across the area (Dinku et al., 2008; Worqlul et al., 2017). Satellite-based rainfall estimation products are increasingly available for use on a global and regional scale to address these challenges. The primary benefit of rainfall products derived from remote sensing is their decent coverage in terms of both space and time, which has served to demonstrate their suitability for use in hydrological and climatic research (Bitew et al., 2012; Tan et al., 2017; Tobin and Bennett, 2014). However, before adopting them for further use in research on drought and other natural hazards, their accuracy must be assessed and contrasted with ground-truth rainfall measurements (Dembélé and Zwart, 2016; Dinku et al., 2008; Stampoulis and Anagnostou, 2012).
Numerous studies have tried to assess and compare satellite rainfall products with measurements made on the ground in a variety of locations (Ayehu et al., 2018; Bayissa et al., 2019; Dembélé and Zwart, 2016; Feidas, 2010; Wiwoho et al., 2021). Among these, Dembélé and Zwart (2016) evaluated the performance of the Africa Rainfall Climatology (ARC2), the Climate Hazards Group InfraRed Precipitation with Stations (CHIRPS), the Precipitation Estimation from Remotely Sensed Information using Artificial Neural Networks (PERSIANN), the African Rainfall Estimation (RFE 2.0), the Tropical Applications of Meteorology using SATellite (TAMSAT), the African Rainfall Climatology and Time-series (TARCAT), and the Multi-satellite Precipitation Analysis (TMPA) satellite rainfall products for Burkina Faso and suggested the applicability of the ARC, RFE, and TARCAT for drought-monitoring research. In Ethiopia, Bitew et al. (2012) evaluated the Climate Hazards Group InfraRed Precipitation with Stations (CHIRPS) v2.0, the Precipitation Estimation from Remotely Sensed Information using Artificial Neural Networks (PERSIANN), the African Rainfall Climatology and Time-series (TARCAT) v2.0, the Tropical Rainfall Measuring Mission (TRMM), and the Africa Rainfall Climatology version 2 (ARC2). Their study selected the CHIRPS as the best-performing satellite rainfall product and used it for meteorological drought variability assessments in the Upper Blue Nile basin. Nevertheless, not much research has been done to determine whether satellite rainfall estimations can be used for meteorological drought-monitoring and early-warning systems, especially in Ethiopia's SNNP region.
The SNNP region is one of the drought-prone areas in Ethiopia. The topography of the region is complex, consisting of lakes, forest highlands, and lowlands (Asefa et al., 2020). The need for accurate rainfall products with higher spatio-temporal resolutions and long-term records for various hydroclimatic assessment purposes in relation to water resources, floods, and droughts has increased in the region. This study therefore aims to (1) validate three high-resolution satellite-based rainfall products, namely the Africa Rainfall Climatology version 2 (ARC2), the Climate Hazards Group InfraRed Precipitation with Stations (CHIRPS), and the Tropical Applications of Meteorology using SATellite and ground-based observations (TAMSAT3), against ground-based rainfall measurements and (2) analyze the spatio-temporal distribution of meteorological drought using the standard precipitation index (SPI) for the 1991 to 2022 study period in the SNNP region of Ethiopia.
2.1 The study area
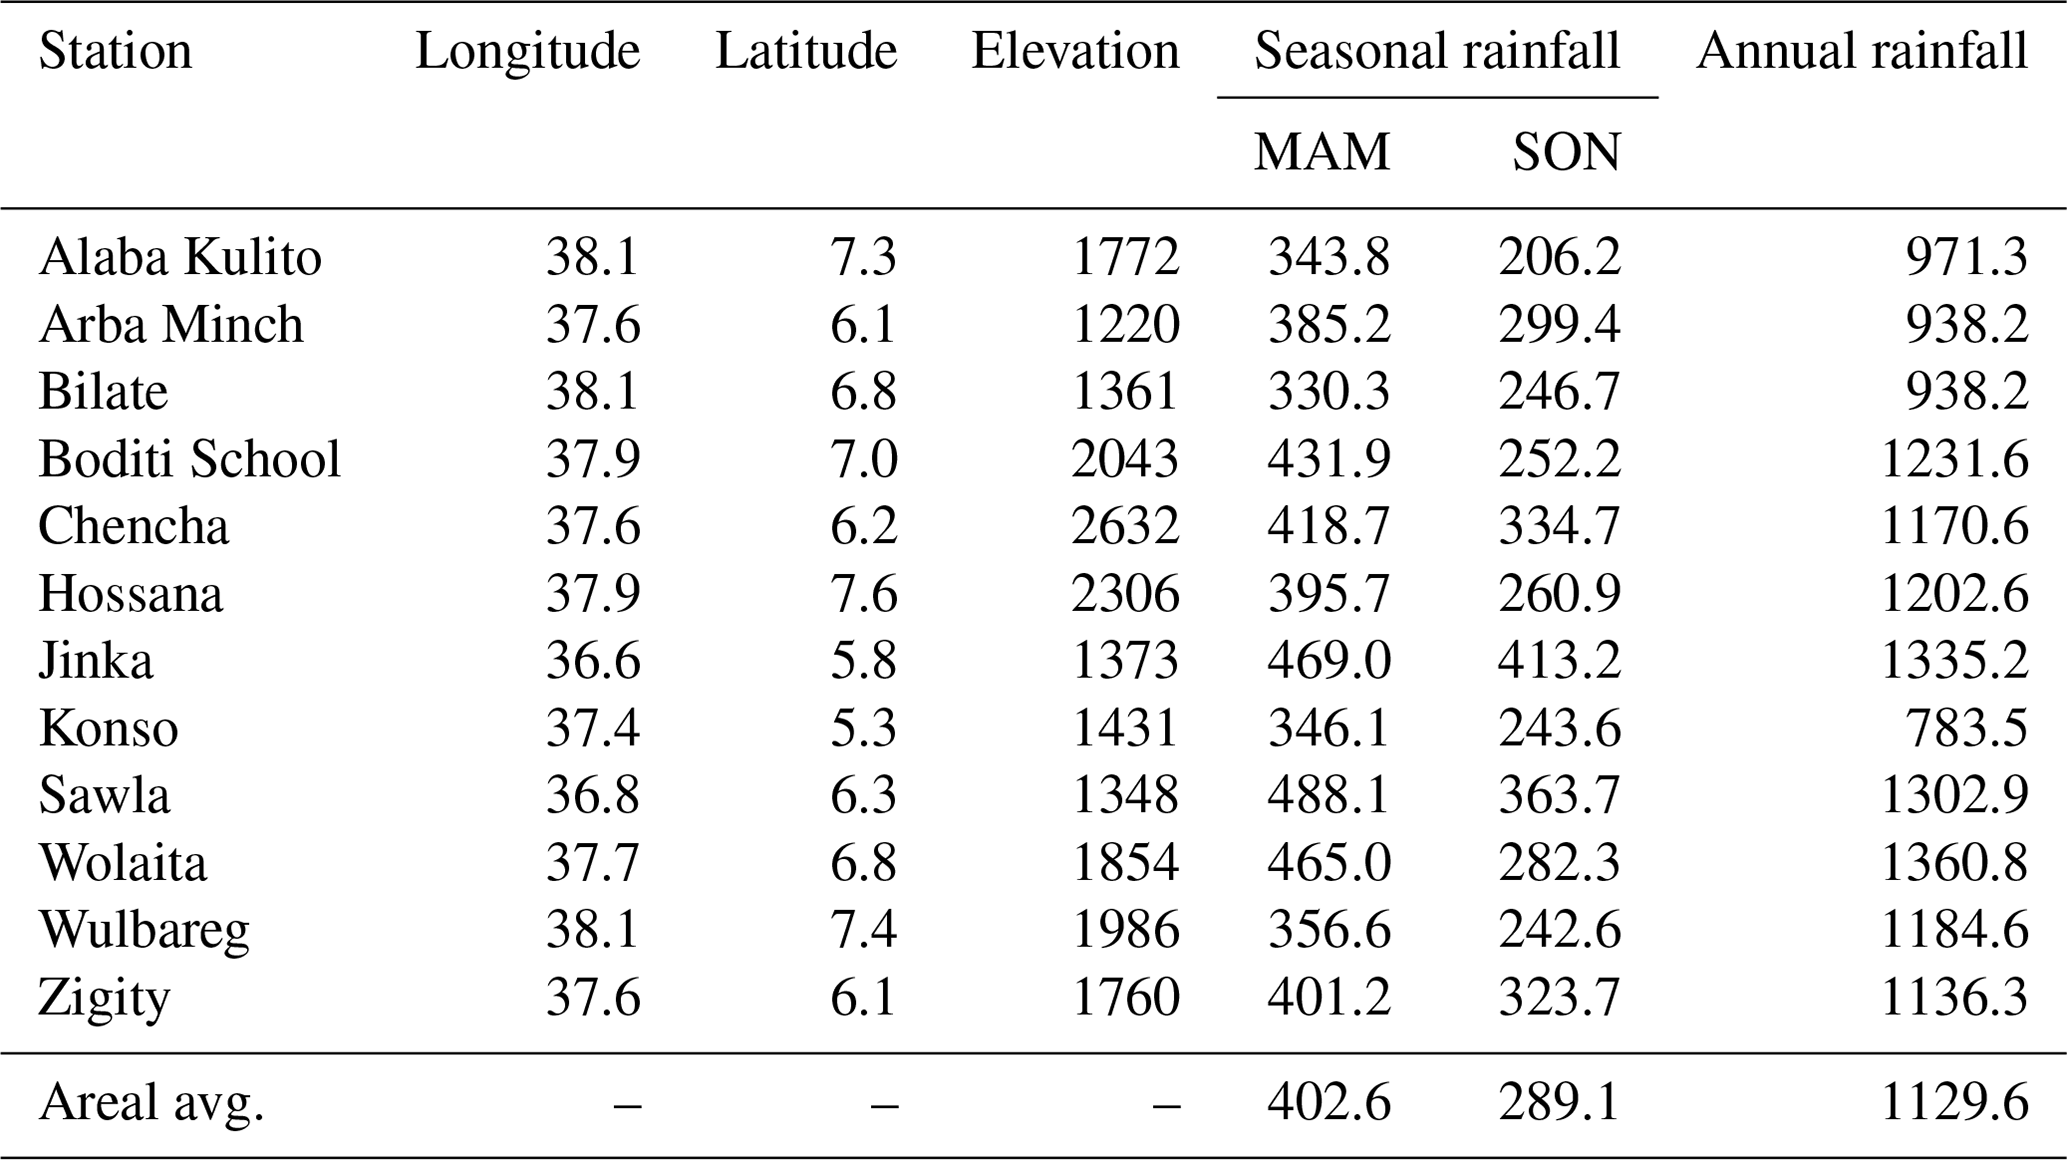
The SNNP region is located in the southern part of Ethiopia between 4.4–8.5° N latitude and 35.8–38.7° E longitude (Fig. 1). The study region covers an area of about 51 813 km2, and the topography of the area ranges from 235 to 3470 m above sea level. The lakes Abaya and Chamo, which are part of the greater Ethiopian Rift Valley lakes, are located in the region. The agro-climatic characteristics of the SNNP region are classified as semi-arid to humid, and the region receives a bimodal rainfall distribution, with its main rainy season from March to May (MAM) and a short rainy season from September to November (SON) (Wakjira et al., 2021). The mean annual rainfall received by the area ranges from 900 to 1400 mm. About 70 %–90 % of the total annual rainfall is contributed by the main rainy season (Legesse, 2016; Salimi et al., 2021). The short rainy season is generally inconsistent and confined to the highland areas. The average annual temperature of the area ranges from 15 °C in the lowlands to over 28 °C in the highlands (Esayas et al., 2018).
The SNNP region is one of the most populated areas in Ethiopia, with a total population of about 5.4 million and with estimated landholding capacity of 0.75 ha, which falls under the national average of 1.2 ha (Amenu and Mamo, 2021). About 90 % of the population lives in rural areas, sustaining themselves through agricultural practices. Mixed agriculture, agroforestry, intensive cropping, intercropping, and enset- and coffee-based land use types are the farming systems dominantly practiced in the different agroecologies. The dominant crops cultivated in the area include teff, barley, maize, lentils, horse beans, chickpeas, and field peas. Despite the availability of rich land resources, crop productivity in the region has not increased to its full potential because of nutrient mining, soil erosion, acidity, and nutrient depletion, as well as a lack of balanced fertilization (Aleminew and Alemayehu, 2020). Chromic Luvisols and Haplic Luvisols are the dominant soil types in the region.
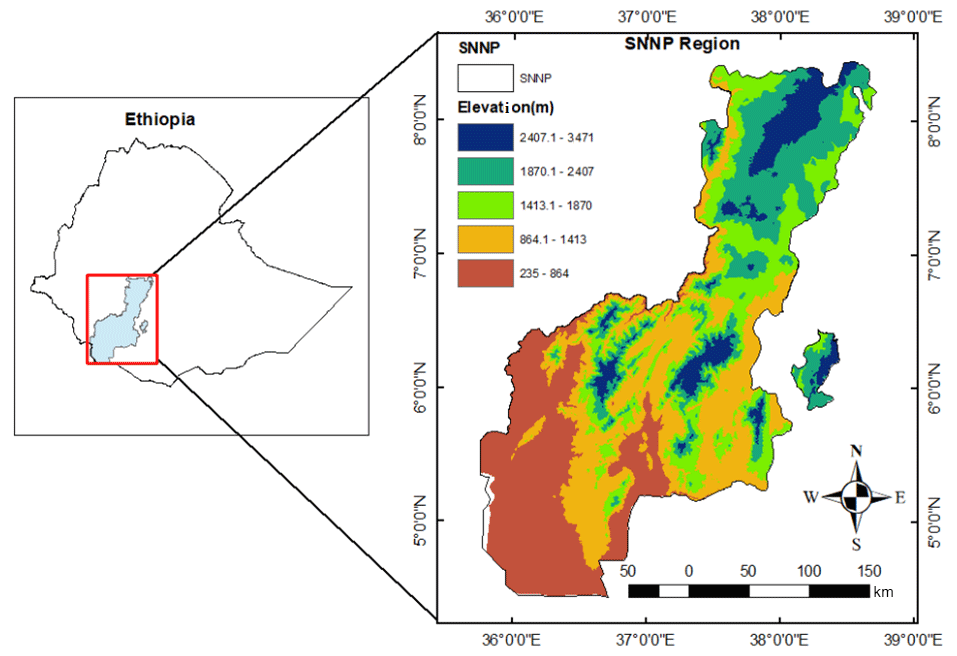
Figure 1Geographical location and elevation map of the study area.
2.2 Data sources
2.2.1 Station data
Daily rainfall data from ground-based meteorological stations were obtained from the Ethiopian Meteorological Instate (EMI) for the 1991–2022 study period. Station selection was based on long-range records that cover the whole study period and represent different agro-climatic zones. The study period was chosen based on the availability of the satellite measurements. Additionally, drought index calculation needs a long period of at least 30 years of data (Yihdego et al., 2019). Hence, 12 stations that have a common record period (1991–2022) and that cover all climate types in the study region are selected for this study (Table 1). The validation and comparison of the three satellite rainfall products against the station-based rainfall were conducted at a monthly timescale.
2.2.2 Satellite data
To fill the gap relating to the spatial and temporal inconsistencies of ground-based meteorological stations in recording rainfall, the study assessed several satellite-based rainfall products and selected three of these, namely the Africa Rainfall Climatology version 2 (ARC2), the Climate Hazards Group InfraRed Precipitation with Stations (CHIRPS), and the Tropical Applications of Meteorology using SATellite and ground-based observations (TAMSAT). These satellite rainfall products have high spatial resolutions that range from 0.05° × 0.05° to 0.25° × 0.25° (≤25 km) and high temporal resolutions that range from hourly to monthly, and they cover relatively long time series of 1981 to the near-present (>30 years). These satellite products are freely available and have been extensively used for rainfall variability and trends globally and in Ethiopia (Bayissa et al., 2019). However, these satellites have not been used to analyze drought indices, particularly in the SNNP region. Although the satellite products are freely available at high spatial and temporal resolutions, they have their advantages and limitations (Levizzani et al., 2002). The satellite-based rainfall used in this study was downloaded from the International Research Institute for Climate and Society (IRI) of Columbia University's data library (Dinku et al., 2008). A detailed description of each satellite rainfall product is given below.
The ARC2 satellite rainfall product, which is a revised version of the ARC1 and extends back to 1981, is becoming homogenous over time and is essential for rainfall trend and variability analysis (Ayehu et al., 2018; Novella and Thiaw, 2013). The ARC2 rainfall product algorithm mainly combines 3-hourly geostationary infrared (IR) data centered over Africa from the European Organization for the Exploitation of Meteorological Satellites (EUMETSAT) and quality-controlled global telecommunication system (GTS) gauge observations reporting 24 h rainfall accumulations over Africa (Novella and Thiaw, 2013). The ARC2 rainfall product provides data at a spatial resolution of 0.10° × 0.10° and at daily and monthly temporal resolutions over the African continent, covering 40° S–40° N and 20° W–55° E. Details of the ARC2 satellite rainfall product can be found in Novella and Thiaw (2013).
The CHIRPS dataset is developed by the US Geological Survey (USGS) and the Climate Hazards Group (CHG) at the University of California (Funk et al., 2015). The CHIRPS is a hybrid product that uses databases primarily from three sources: first, in situ ground-based precipitation measurements; second, pentad (5 d)-based rainfall estimates from thermal infrared (TIR) satellite measurements from climatology archives of the National Oceanic and Atmospheric Administration (NOAA) Climate Prediction Center dataset (CPC) and the Tropical Rainfall Measuring Mission Multisatellite Precipitation Analysis (TMPA 3B42); and, third, the National Climate Forecast System version 2 (CFSv2) (Ayehu et al., 2018; Shalishe et al., 2022). The CHIRPS rainfall product is available at a quasi-global (50° S–50° N) coverage, with a spatial resolution of 0.05° × 0.05° (∼ 5.3 km) and a temporal resolution of daily, pentad, decadal, and monthly timescales (Funk et al., 2015). Figure 2 illustrates the boxplot of the monthly rainfall in the study area for 1991–2022. The line plot indicates the mean rainfall value for each month. The rainy seasons (MAM and SON) of the present study area are well explained by the plot unless affected by some stations in the northern part of the study area, which receives only some rainfall during what is otherwise the main rainy season for most parts of Ethiopia (June–August).
The TAMSAT product is developed by the University of Reading based on Meteosat thermal infrared (TIR) measurements for the whole of Africa. The TAMSAT rainfall estimation algorithm based on the TIR imagery is used to collect information about the cloud top of cumulonimbus clouds, considering the convective cloud tops to be indicators of rainfall (Estébanez-Camarena et al., 2023; Maidment et al., 2020). These estimates are validated and show good performance in that rainfall is generally associated with these convective clouds. The TAMSAT is available in various versions, specifically the TAMSAT2 and TAMSAT3. The TAMSAT2 has been validated over the complex topography of Ethiopia and performs well and is skillful (Young et al., 2014). The TAMSAT rainfall products have been available since 1983 until the near-present at a spatial resolution of 0.25° × 0.25° and on decadal, monthly, and seasonal timescales. The TAMSAT rainfall estimation algorithm was developed over West Africa during the 1980s; however, currently, it is available for the whole African continent at monthly timescales (Tarnavsky et al., 2014). The present study assessed the performance of the recent version of the TAMSAT product (TAMSAT3). Even though the development principles and methods of the TAMSAT2 and TAMSAT3 are similar, some improvement procedures have been applied to the latest version, the TAMSAT3 (Ayehu et al., 2018). The TAMSAT3 was validated over many parts of Africa (e.g., Mozambique, Niger, Nigeria, Uganda, and Zambia), and small were found errors, with lower RMSE and MAE values, as compared to the TAMSAT2.
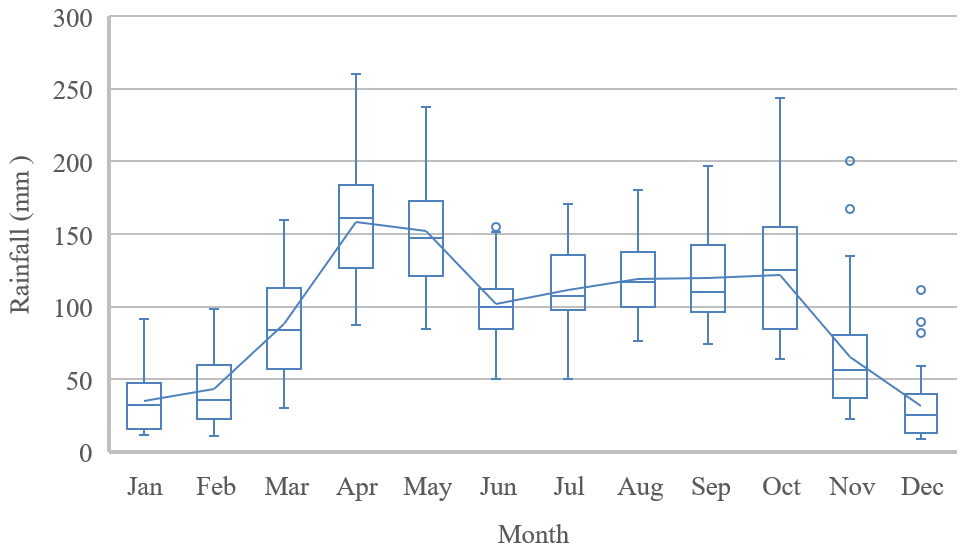
Figure 2Boxplot of monthly precipitation based on CHIRPS data over southern Ethiopia, 1991–2022.
Table 1Description of the meteorological stations used in this study and areal averages.
The analysis conducted to achieve the results of this study follows two primary approaches: (1) validation of the three satellite products by comparison with station-based measurements using selected statistical measures and (2) drought index estimation using the SPI. The Climate Data Tool (CDT) version 8 was used for the statistical comparisons and SPI calculations. The CDT is a free, open-source, R-based software package used to organize, quality control, merge, validate, analyze, and visualize meteorological data (Dinku et al., 2021). The tool is widely used by meteorological service offices and other researchers in Africa.
3.1 Validation of satellite products
The study used aggregated data from 12 meteorological stations at monthly timescales to validate and compare the performance of the three satellite rainfall products over the SNNP region for the 1991–2022 period. A comparison of the satellite products with the ground-based rainfall measurements was performed based on grid-to-point approaches as described in Tadesse et al. (2022). The statistical techniques used for validation in this study are partially adopted from Shalishe et al. (2022). These statistical techniques are the correlation coefficient (CORR), coefficient of determination (R2), bias (BIAS), percent bias (PBIAS), mean absolute error (MAE), root mean square error (RMSE), and Nash–Sutcliffe efficiency coefficient (NSE). The Pearson correlation coefficient CORR calculates the linear relationship between the ground-based observed rainfalls and satellite estimates (Zambrano-Bigiarini et al., 2017). Bias measures how the average satellite rainfall estimate compares with the ground-based observed rainfall (Kimani et al., 2017). An overall satellite overestimation (underestimation) of ground-based precipitation levels is indicated by a bias value above (below) 1. RMSE quantifies the patterns of similarity between values of satellite estimates and observed measurements. The mean absolute error (MAE) indicates the absolute mean deviation of the satellite rainfall estimates from the ground-based rainfall measurements (Santos et al., 2018). Values that are closer to zero for both MAE and RMSE indicate good performance. The mathematical representation and corresponding value of each statistical metric used in this study are given in Table 2.
Table 2The statistical measures used for comparisons of the gauge-based and satellite rainfall measurements.
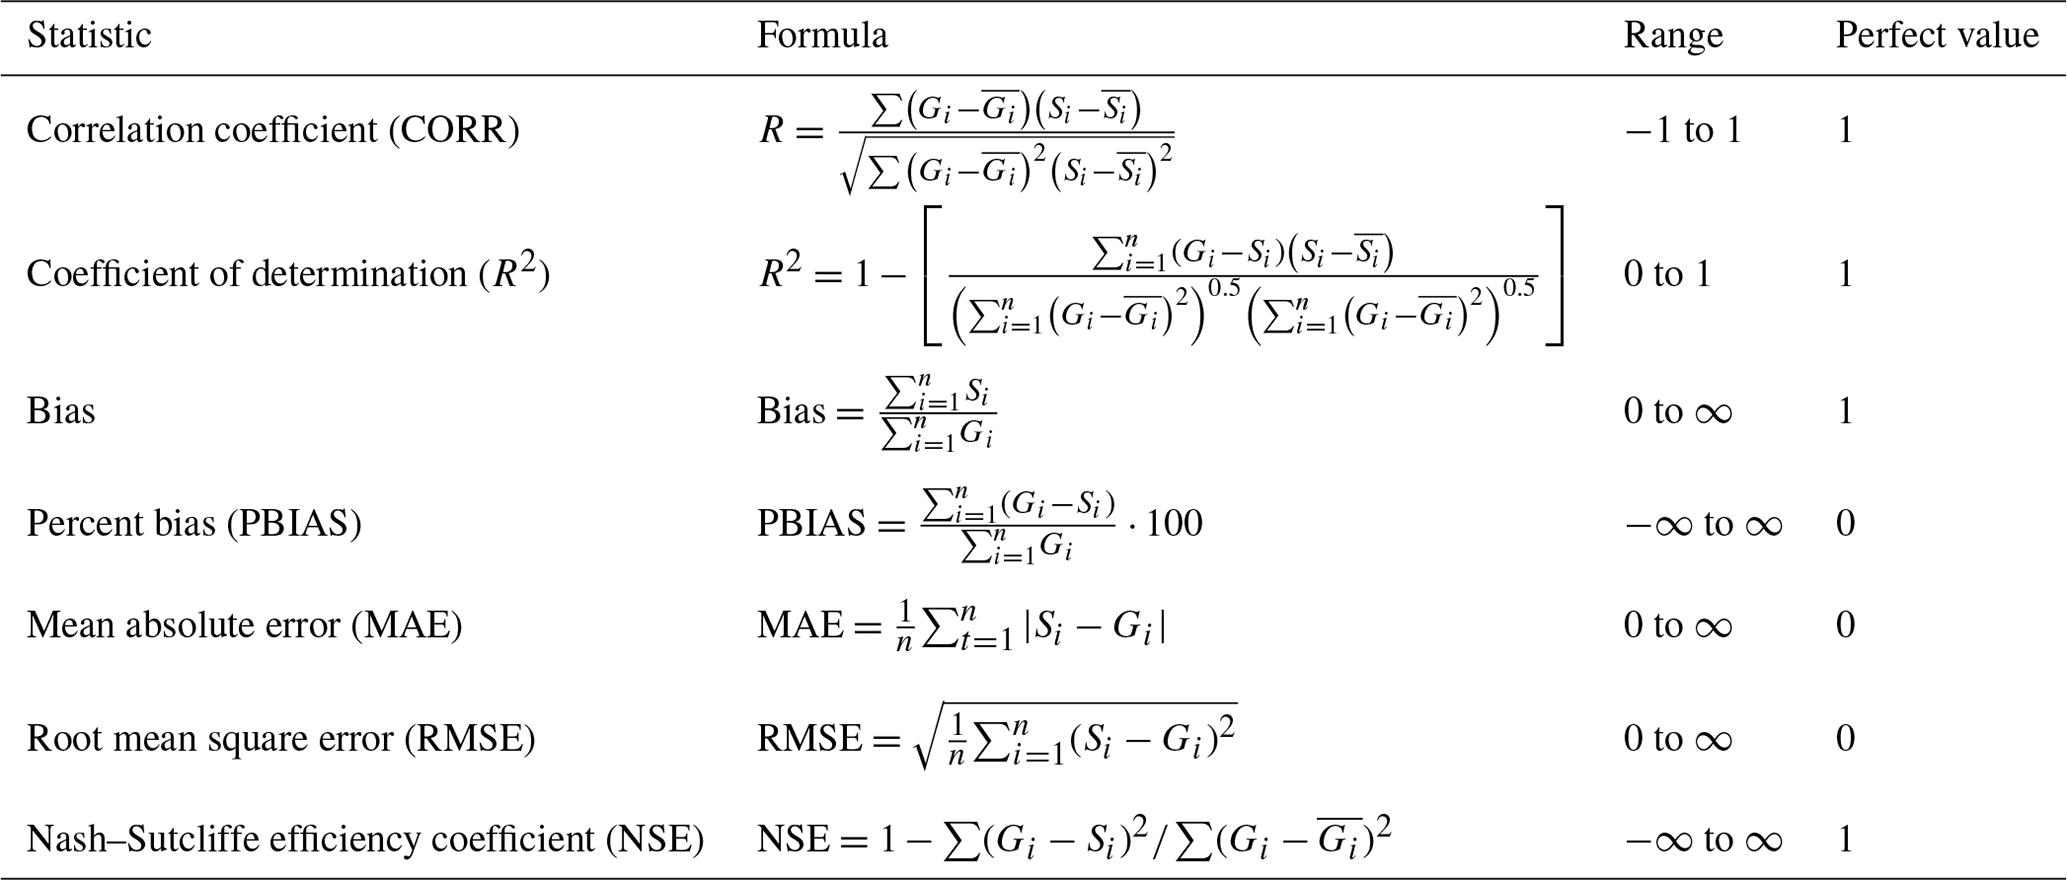
Note that Gi is the gauge rainfall observations, Si is the satellite rainfall estimates, is the average gauge rainfall observations, is the average satellite rainfall estimates, t is the threshold values (t≥1 mm), and N is the number of data pairs.
3.2 Standardized precipitation index (SPI)
The standardized precipitation index (SPI) was developed by McKee et al. (1993) and is one of the most widely used meteorological drought indices applied globally and regionally. The SPI is recommended by the World Meteorological Organization (WMO) to be used as an indicator of rainfall amount at different timescales and as a reference drought index (Shalishe et al., 2022). Its simplicity in terms of computation and its use of one climate variable, precipitation, makes the SPI a widely preferable drought indicator. Previous studies that used comparisons of multiple drought indicators recommend the SPI as a better drought indicator, having good spatial and temporal consistencies (Khalili et al., 2011; Li et al., 2020).
The SPI is an index in which the probability of rainfall is presented for a data series greater than or equal to 30 years; indexes are therefore given for 3-, 6-, 9-, 12-, 24-, and 48-month scales. The assumptions for index calculation include the following: precipitation is more variable than any other climate variable, and any variable other than precipitation has negligible temporal trends (Li et al., 2020). Since precipitation does not show a normal distribution, the fitting of the dataset with an appropriate frequency distribution for each timescale is vital. Therefore, it is after the fitting to a normal distribution that the SPI values become the standard deviance from the median, with a mean of zero and a variance of unity. In this study, the monthly rainfall of 1991–2022 is fitted with a gamma distribution function G(x), as in Shawky and Bakoban (2012) (Eq. 1), and the 3- and 12-month SPI values were calculated for the SNNP region. The SPI-3 covers the months of the main rainy season (March to May), and the values of the SPI-12 were calculated for 12 months, starting from January. The procedures for SPI calculation are presented by the following equations, as described in McKee et al. (1993).
Here, g(x) is the probability density function; x is the precipitation amount; α<0 and β>0 are the shape and scale parameters, respectively; and Γ(α) is the gamma function. To find the resulting parameters used to calculate the SPI, the components in Eq. (1) can be further refined as
Then the cumulative probability distribution function in Eq. (1) becomes
The null-precipitation records may not be represented or may cause the above equation to be undefined; hence, the zero records of precipitation can be represented in the cumulative distribution function (CDF) by
where q is the probability of null precipitation, and G(x) is the CDF.
Finally, after converting the CDF into standard normal distributions, the SPI can be given as
Here, c0=2.5155, c1=0.8028, c2=0.0103, d1=1.4327, d2=0.1892, and d3=0.0013 are mathematical constants.
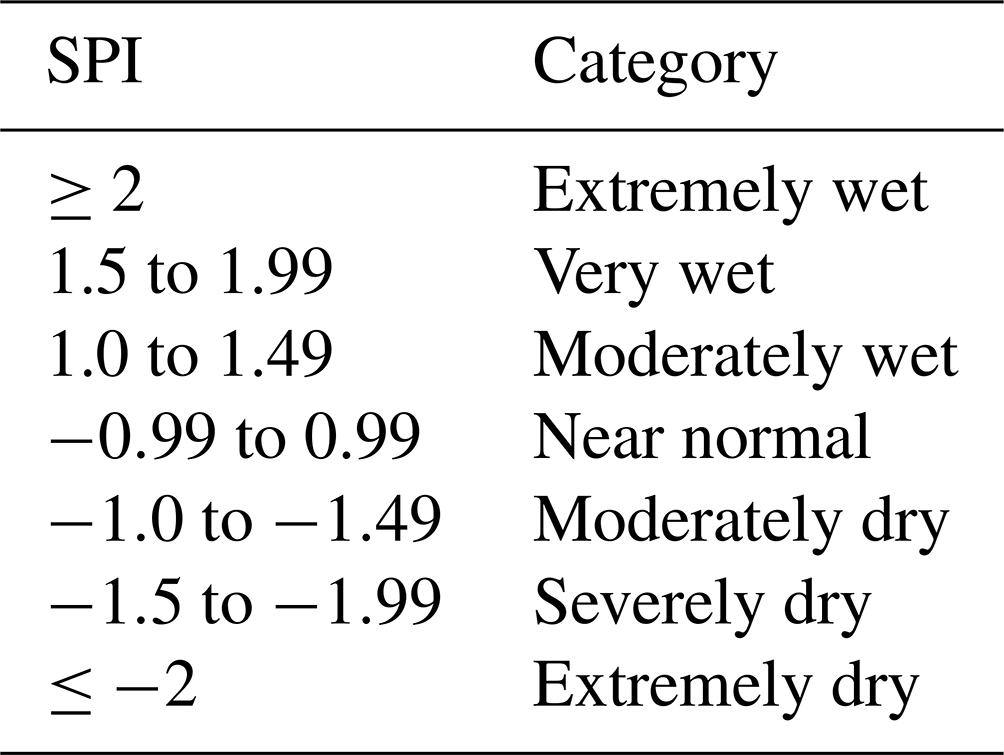
Droughts can be characterized by their duration (D), frequency (F), severity (S), and intensity (I) (Brito et al., 2018). D can be defined as the number of months between the start of the drought and the end of the drought after the drought events, where precipitation falls below the given threshold, are identified (Brito et al., 2018; Van Loon, 2015). F is presented by the number of drought events in the whole study period and depicts how often a drought occurs. S is defined as the absolute value of the precipitation from the start to the end of the drought period. Finally, I is expressed as the ratio of S to D, where drought events with large intensities will be those that have shorter durations and higher severity (Ayugi et al., 2019). In this paper, the 3-month and 12-month drought indexes (SPI-3 and SPI-12) were selected to indicate the severity of droughts in the SNNP region. While the SPI-3 is more suitable for extracting the short-term duration of meteorological drought, which is critical for crop growth, the SPI-12 extracts medium-term droughts and reflects the hydrological consequence of droughts (Li et al., 2020). Table 3 presents the classification of drought intensities as proposed by McKee et al. (1993).
4.1 Statistical comparison
The three satellite rainfall estimate products were compared with the station rainfall measurements and with each other both temporally and spatially. Initially, the three rainfall estimate products were validated against the gauged monthly rainfall data collected between 1991–2022. Table 4 represents the performance of the satellite-based rainfall estimates against the gauged rainfall, and all products showed a considerably good estimate, with a CORR of >0.8. However, the CHIRPS estimates were the best, with a CORR of 0.96, R2 of 0.91, and BIAS of 1.02. These also showed minimal PBIAS and RMSE values of 1.95 and 15.90, respectively. The TAMSAT, similarly, is the second-best performer, with CORR of 0.83 and PBIAS and RMSE values of 4.39 and 35.51, respectively. The ARC2, on the other hand, showed a comparatively low CORR and high PBIAS and RMSE. The main reason for the CHIRPS's strong performance in the research area is that it combines a variety of input data sources, such as in situ precipitation observation and other satellite estimates, among many others. The good performance of the CHIRPS in estimating rainfall is also confirmed by the previous studies of Atiah et al. (2020) and Dembélé and Zwart (2016). A relatively recent study in the Gamo Zone, which is part of the present study area, by Shalishe et al. (2022) also found that the CHIRPS performs very well, with a CORR of 0.88 and an NSE of 0.77, and it is suggested to be a valuable rainfall product in the Gamo Zone and nearby areas.
On the other hand, the ARC2 showed poor performance in estimating the rainfall of the SNNP region. Some of the statistical outputs include R2 of 0.44, BIAS of 0.67, and RMSE of 45.77, among others, implying that the estimation is relatively poor. The PBIAS and ME values shows negative values, indicating that the ARC2 underestimates the rainfall over the SNNP region. The poor performance of the ARC2 is reported by the previous studies of Atiah et al. (2020) and Diem et al. (2014), whose results have confirmed its inconsistencies in rainfall estimation, particularly in the East Africa region. Additional information about the satellite estimates and the corresponding statistical values used for comparison can be obtained in Table 4.
Table 4Statistical performance of the three satellite products in rainfall estimation.
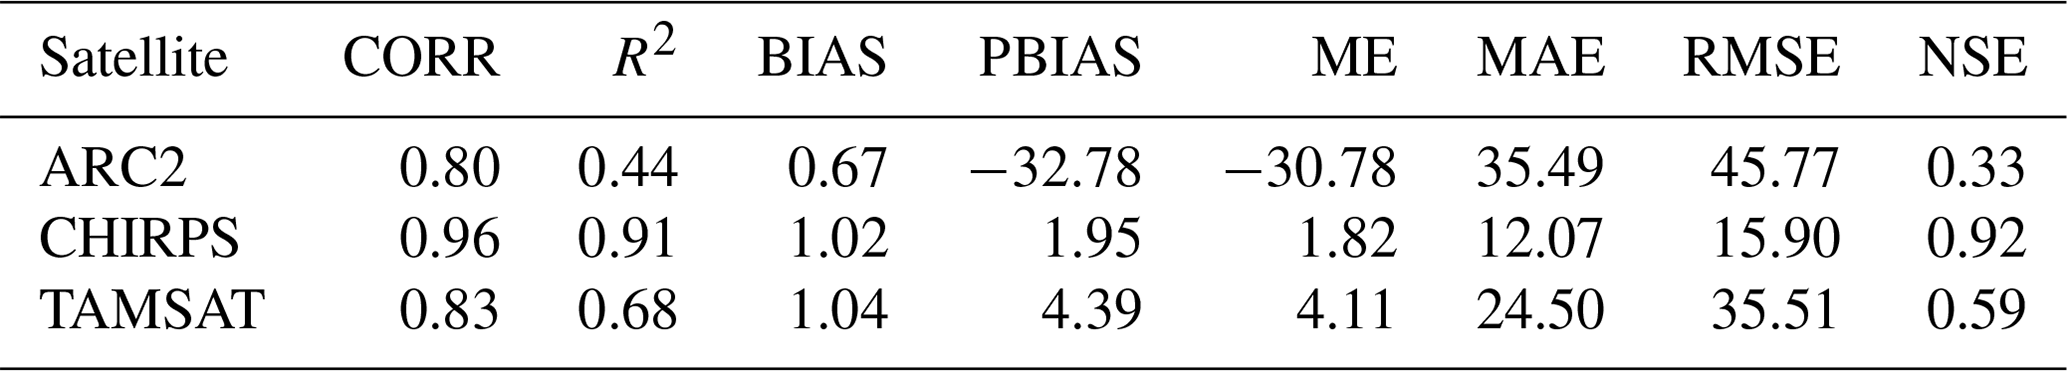
Figure 3 shows scatterplots and CDF values of the three satellite rainfall products, and a spatial comparison of satellite rainfall estimates against gauge measurements for the main rainy season (March–May) and on an annual timescale is given in Fig. 4. Considering the scatterplots, the CHIRPS presents strong agreement with the gauge measurements. Similarly, on the CDF plots, the CHIRPS shows good correspondence to the gauge measurements, with a closer distribution, followed by the TAMSAT. On the other hand, the ARC2 shows the lowest correspondence between the product estimate and the gauge. The ARC2 estimates that about 90 % of the data are above 100 mm, whereas the CHIRPS and TAMSAT estimate that only about 60 % of the data reach 100 mm. Hence, the scatterplot and corresponding CDF indicate that the ARC2 remarkably overestimates rainfall over the SNNP region. The spatial plots also show similar correspondence, in which the CHIRPS is able to estimate the rainfall for the main rainy season (MAM) and at annual timescales over the SNNP region.
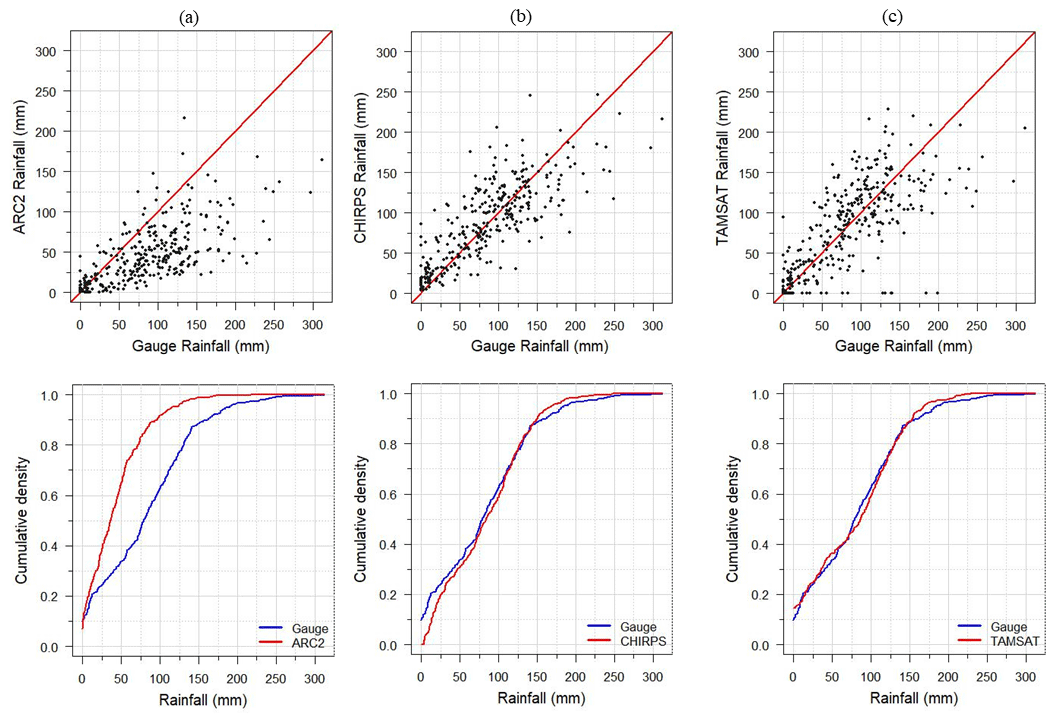
Figure 3Comparison of the three satellite rainfall products, (a) the ARC2, (b) the CHIRPS, and (c) the TAMSAT, against ground-based measurements over the SNNP region for 1991–2022 period.
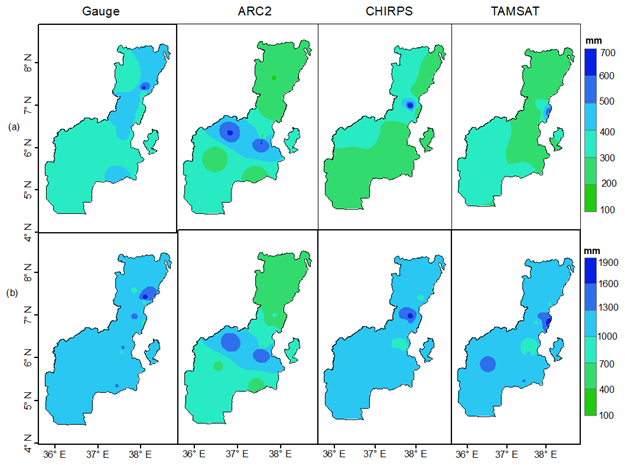
Figure 4Comparison of the three satellite products against station-based observed rainfall (a) for the main rainy season (March–May) and (b) annually over the SNNP region for the 1991–2022 period.
4.2 Drought analysis
In this section, the spatial and temporal patterns of drought for the SNNP region are presented. The CHIRPS rainfall estimates, which perform well among the other satellite-based rainfall products, were used in the subsequent sections to study the temporal and spatial assessments of meteorological drought for the period from 1991 to 2022 over the SNNP region. The SPI-3 and SPI-12 are used to present the patterns of drought; while the SPI-3 is critical for plant development and farming activities, the SPI-12 can indicate the responses of different water suppliers and reservoirs to rainfall shortages (Caloiero et al., 2021; Kalimeris and Kolios, 2019).
4.2.1 Temporal drought analysis
The time series plots of the 3- and 12-month-period droughts at the six chosen meteorological stations, Arba Minch, Bilate, Hossana, Jinka, Konso, and Wolaita, from 1991 to 2022 are shown in Fig. 5. The blue bars indicate wet conditions (positive SPI), and the red bars indicate dry conditions (negative SPI). The horizontal dashed lines at ±1.5 indicate the occurrence of very wet and very dry extreme conditions during the study period. Accordingly, the station Bilate records the highest (33) occurrence of extreme droughts, and Konso records the lowest number (15) of extreme droughts for the short drought timescale of the SPI-3. Similarly, the station Arba Minch records the highest (28) occurrence of extreme droughts, and Jinka records the lowest number (10) of extreme droughts for the medium drought timescale of the SPI-12. Most of the meteorological stations experienced severe to extreme droughts in common years (e.g., 1999, 2000, 2002, 2005, 2009, and 2010), indicating that the entire study area had experienced severe droughts. For the areal averages, 39 mild, 17 severe, and 4 extreme drought events were recorded for the SPI-3, and 39 mild, 15 severe, and 3 extreme drought events were recorded for the SPI-12 (Fig. 6). The outcome demonstrates that the research area experiences periods of moderate to excessive dryness. Certain years, such 2000–2001, 2009–2010, 2014–2015, and 2021–2022, were among the noted Ethiopian historic drought years. The meteorological-drought temporal assessment of the present study also revealed the existence of drought years with varying degrees of severity. In 2009–2010, for instance, all stations, with the exception of Konso, experienced severe to extreme drought conditions with different intensities.
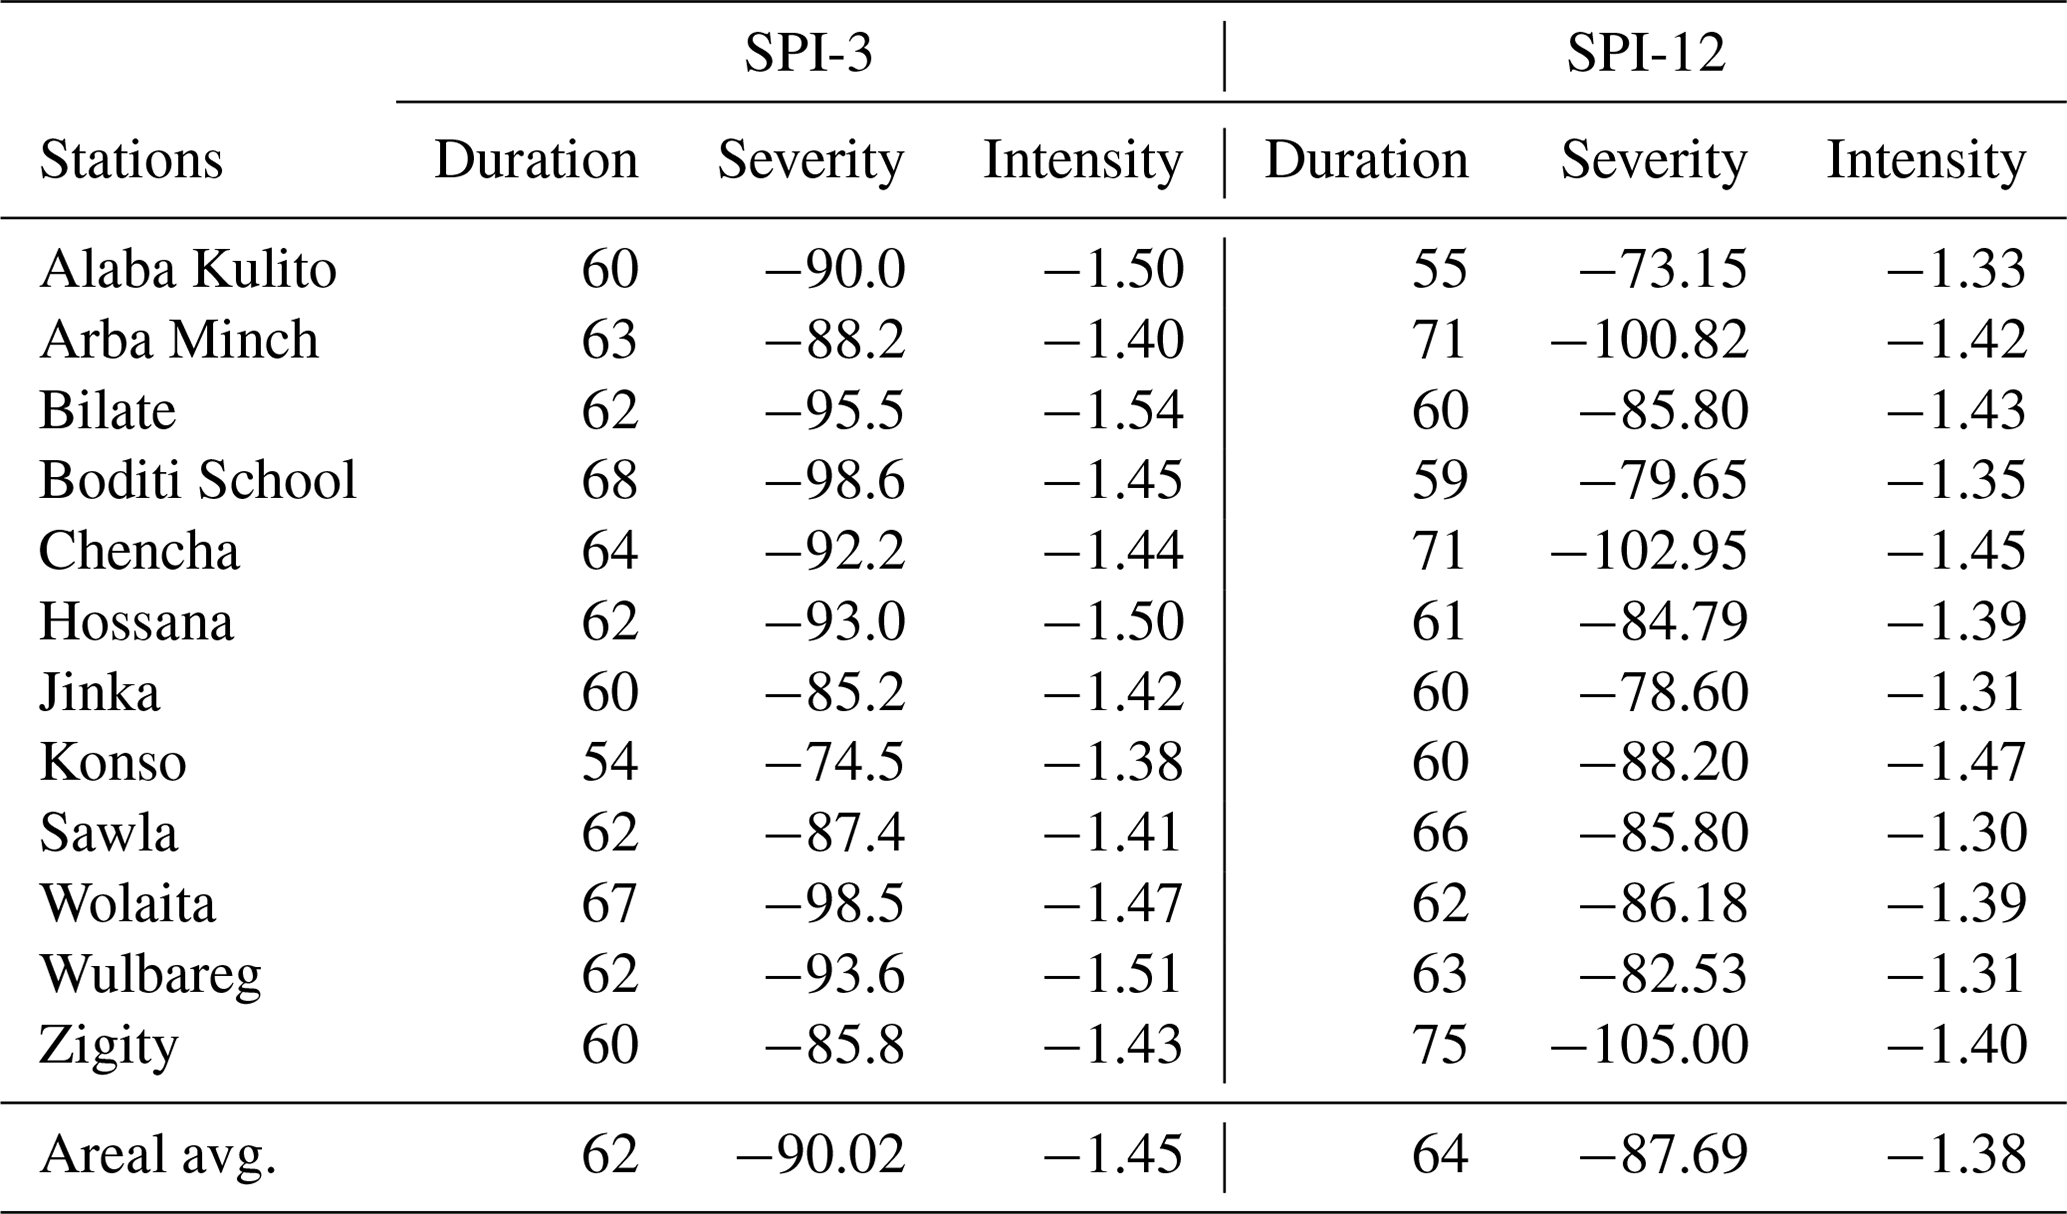
The droughts are characterized by different severity levels, with the SPI-3 experiencing droughts ranging from −1.38 to −1.54 and the SPI-12 experiencing droughts ranging from −1.30 to −1.47; this indicates that most drought events were severe droughts based on the SPI drought indices (Table 5). At Sawla station, the lowest intensity was displayed (−1.30). The stations located in the southern and eastern parts of the SNNP region generally showed more signs of drought than the stations in the northern region. Droughts that were quite persistent were noted in the years 2000–2001 and 2009–2010. The region's drought duration, severity, and intensity are further displayed in Table 5. Even though the study considered all drought durations, it was found that, when averaged over the study area for both the 1991–2022 study period and the six stations, there was a reasonably significant and intense drought. Consequently, since the SPI-3 is based on the primary rainy season in the SNNP region, regular monitoring of these severe droughts is advised. On the other hand, the years 2014 and 2020 are relatively wet years for the study area. The study's temporal evaluation results are consistent with earlier research in one zone of the current study area; e.g., Shalishe et al. (2022) found moderate to severe drought events in 2000–2020. A study by Liou and Mulualem (2019) also reveals that droughts in southern Ethiopia are severe and cover large areas of the region. Therefore, the CHIRPS rainfall can serve as a backup information source for early-warning systems and drought monitoring in the SNNP region and its surrounds.
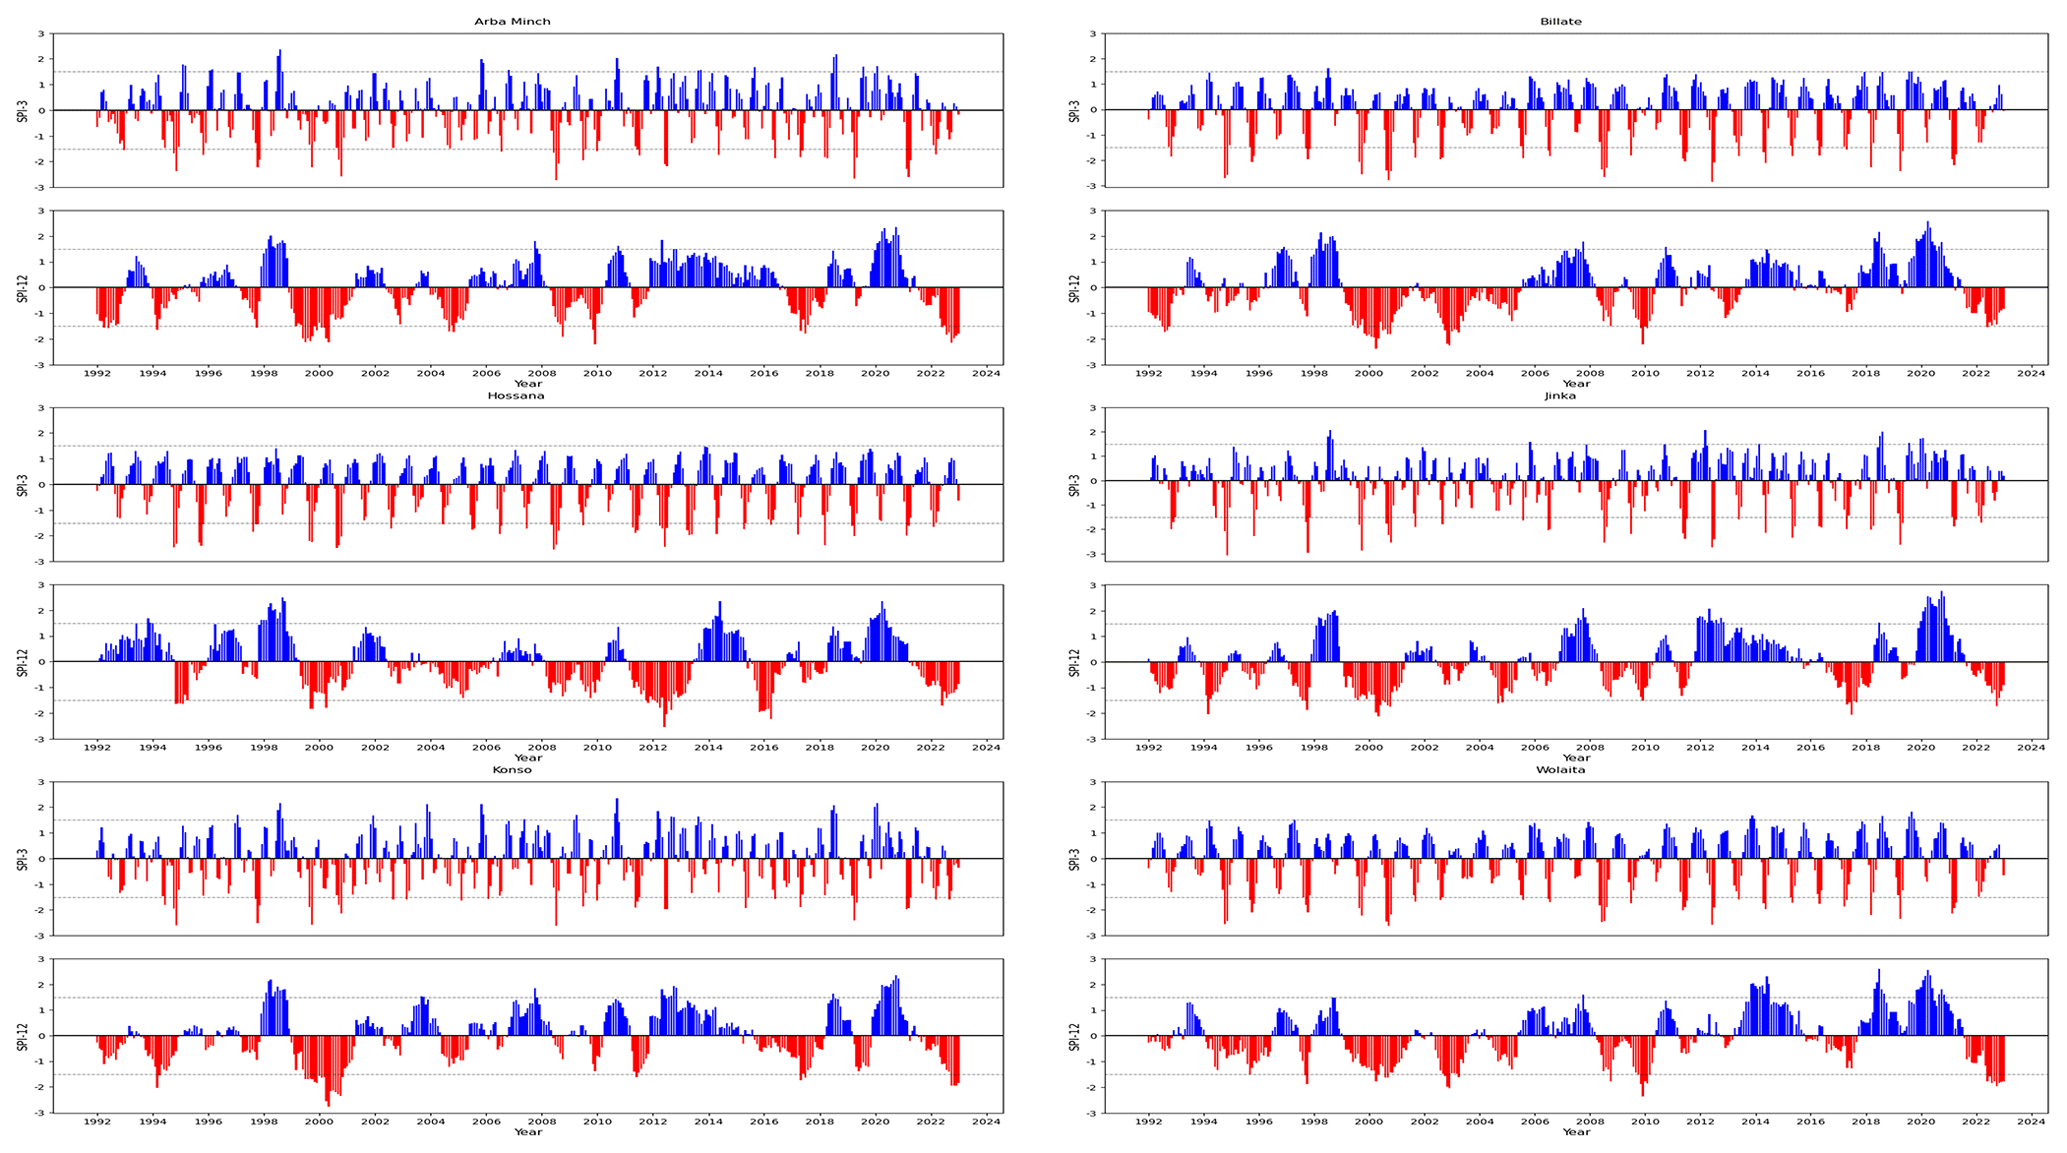
Figure 5Time series plot of the SPI-3 and SPI-12 droughts at six selected meteorological stations for 1991–2022.
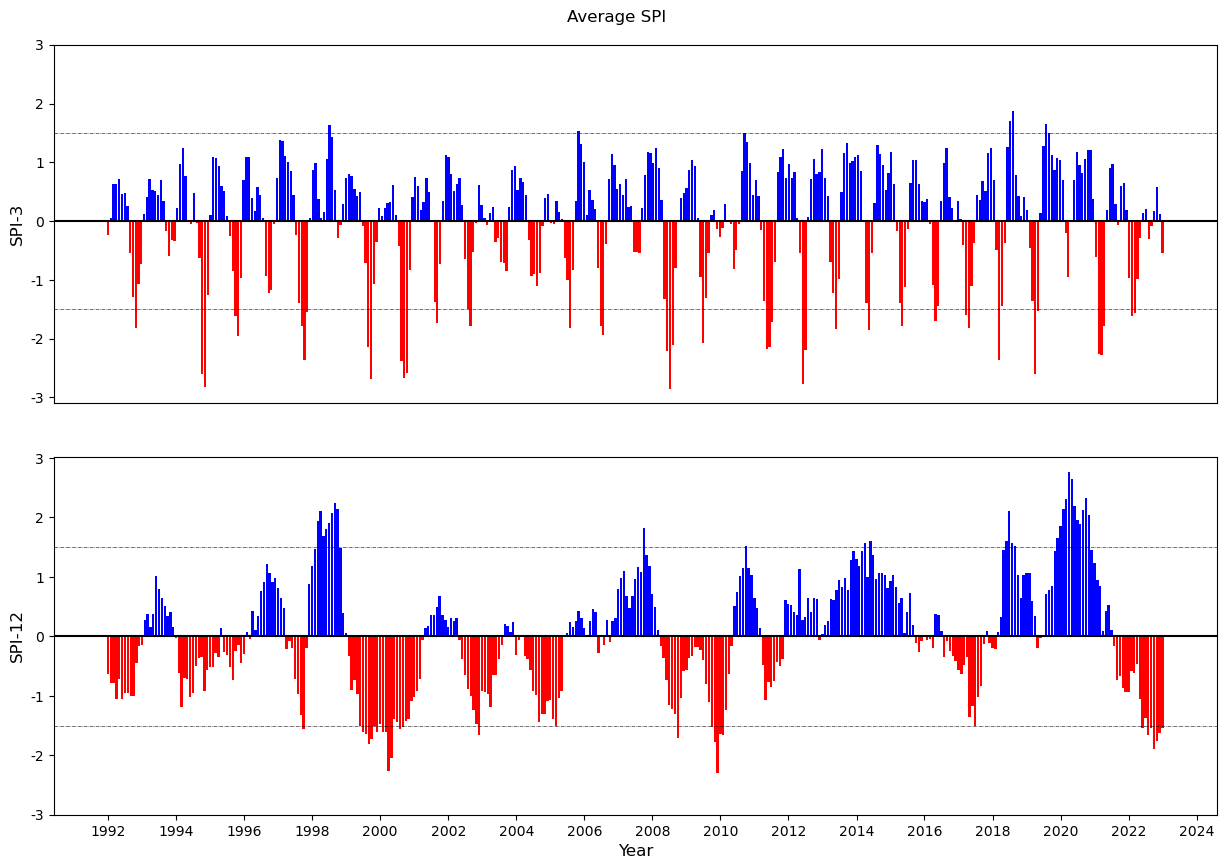
Figure 6Time series plot of the SPI-3 and SPI-12 droughts spatially averaged over the SNNP region for 1991–2022.
Table 5The duration, severity, and intensity of the major dry events (SPI-3 and SPI-12) over each station and the SNNP region for 1991–2022.
4.2.2 Spatial drought analysis
Figure 7 shows the spatial distribution of meteorological drought for the main rainy season (March, April, and May) for selected recent drought years, namely 2000, 2009, and 2022, based on the SPI-3. Accordingly, In the year 2000, the highest drought event was recorded in the northern part of the SNNP region during March and in the southern part of the SNNP region during April and May. Similarly, very dry to extremely dry conditions are observed in the southern and eastern parts of the SNNP region, particularly during May 2009 and March 2022. Previously, a study by Viste et al. (2013) reported that the year 2000 was all dry in the south of Ethiopia, mainly due to dry spring seasons. The study also reveals that the 2008–2011 dry springs (March to May) affected large parts of Ethiopia, particularly the south, in which March to May is the main rainy season. Similarly, Fig. 8 indicates the spatial distribution of the wet months observed in the study. Accordingly, the year 2020 was reported to be a year without a drought since all regions, with the exception of a few isolated areas experiencing a little drought, were reported as having no drought. The index also revealed the spatial extents of other past drought years (not depicted). Overall, the drought index made it quite evident which parts of the region were wet and which were parts drought-ridden. Therefore, it is possible to examine the geographical evaluation of drought and create a drought-monitoring and early-warning system in the region using the CHIRPS precipitation product.
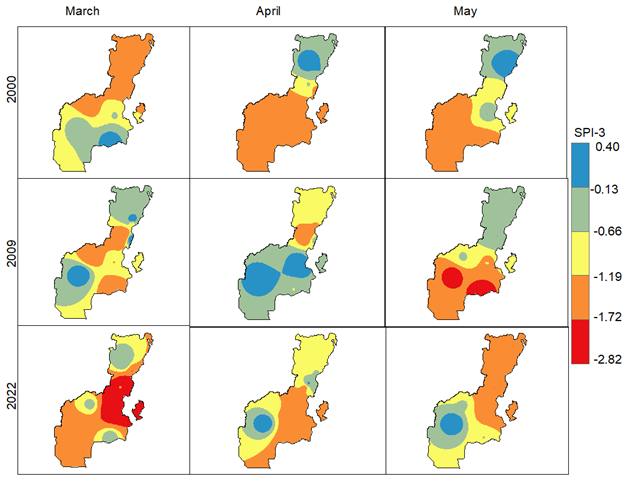
Figure 7The spatial distributions of meteorological drought (SPI-3) during recent drought years, namely 2000, 2009, and 2022.
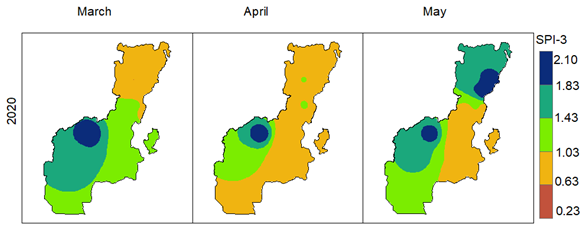
Figure 8The spatial distributions of meteorological drought (SPI-3) during the recent non-drought year 2020.
In developing countries with little data, the availability of rainfall products obtained from satellites at both local and global scales has been helpful in bridging the data gap. However, any application that involves researching drought and water resource issues must evaluate these rainfall products. In this study, gauged rainfall data from 12 independent meteorological stations spread across the SNNP region were compared with the performances of three satellite rainfall products (the ARC2, the CHIRPS, and the TAMSAT). The statistical comparison was used for the performance evaluation at monthly timescales. In order to determine the optimal satellite rainfall product for the study region's temporal and spatial assessment of meteorological drought, an evaluation process was carried out. Accordingly, the CHIRPS was selected as the best product, followed by the TAMSAT. Hence, the CHIRPS was used for the analysis of operational drought-monitoring and early-warning systems at monthly timescales. The good performance of the CHIRPS may be associated with the number of ground observation station data used for reconstruction.
The drought analysis showed that the SNNP region has had mild to severe previous drought occurrences, which is in accordance with the temporal assessment of meteorological drought in the region. The SPI-3 showed the occurrence of moderate-to-severe and moderate-to-extreme drought cases during the early 21st century, while the SPI-12 showed an overall increase in the occurrence of severe drought over the study location, with an observed intensity of 1.54 and a cumulative frequency of 64 months during the study period. More than half of the studied meteorological stations displayed the severity of the known drought years, including 2015–2016, 2009–2010, and 1999–2000. On the other hand, the spatial analysis of drought in the SNNP region showed the occurrence of the extreme drought event that covered mainly the central, southern, and southeastern parts of the region. The 2009 drought was remarkable and clearly indicated in the drought-prone parts of the SNNP region (i.e., the southern and southeastern parts). Generally, the results indicated that the CHIRPS rainfall product could be used as an alternative source of information to develop the drought-monitoring tools for an early-warning system in the SNNP region and its surrounds.
The data utilized in this study are available on request from the corresponding author.
TMW analyzed and interpreted the data on climate and drought in the SNNP region. TBG revised and contributed to polishing the paper. Both the authors read and approved the final paper.
The contact author has declared that neither of the authors has any competing interests.
Publisher's note: Copernicus Publications remains neutral with regard to jurisdictional claims made in the text, published maps, institutional affiliations, or any other geographical representation in this paper. While Copernicus Publications makes every effort to include appropriate place names, the final responsibility lies with the authors.
We are indebted to the Ethiopian Meteorological Institute (EMI) for providing the long-term meteorological data.
This paper was edited by Chris Forest and reviewed by three anonymous referees.
Aleminew, A. and Alemayehu, M.: Soil fertility depletion and its management options under crop production perspectives in Ethiopia: A review, Agricultural Reviews, 41, 91–105, 2020.
Amenu, B. T. and Mamo, G. S.: Impacts of Population Pressure on Agricultural Production and Farming Practices of Households: The Case of Essera Woreda in Dawro Zone, SNNPR, Ethiopia, Earth Sci., 10, 298–314, 2021.
Asefa, M., Cao, M., He, Y., Mekonnen, E., Song, X., and Yang, J.: Ethiopian vegetation types, climate and topography, Plant Divers., 42, 302–311, 2020.
Atiah, W. A., Amekudzi, L. K., Aryee, J. N. A., Preko, K., and Danuor, S. K.: Validation of satellite and merged rainfall data over Ghana, West Africa, Atmosphere, 11, 859, https://doi.org/10.3390/atmos11080859, 2020.
Ayehu, G. T., Tadesse, T., Gessesse, B., and Dinku, T.: Validation of new satellite rainfall products over the Upper Blue Nile Basin, Ethiopia, Atmos. Meas. Tech., 11, 1921–1936, https://doi.org/10.5194/amt-11-1921-2018, 2018.
Ayugi, B., Eresanya, E. O., Onyango, A. O., Ogou, F. K., Okoro, E. C., and Okoye, C. O.: Review of meteorological drought in Africa: historical trends, impacts, mitigation measures, and prospects, Pure Appl. Geophys., 179, 1365–1386, 2022.
Ayugi, B., Tan, G., Rouyun, N., Zeyao, D., Ojara, M., and Mumo, L.: Characterization of historical trends of droughts and pluvial scenarios over Kenya, East Africa, Preprints.org [preprint], https://doi.org/10.20944/preprints201912.0343.v1, 25 December 2019.
Bayissa, Y., Tadesse T., and Demisse G.: Building a high-resolution vegetation outlook model to monitor agricultural drought for the Upper Blue Nile Basin, Ethiopia, Remote Sens., 11, 371, https://doi.org/10.3390/rs11040371, 2019.
Bitew, M. M., Gebremichael, M., Ghebremichael, L. T., and Bayissa, Y. A.: Evaluation of high-resolution satellite rainfall products through streamflow simulation in hydrological modeling of a small mountainous watershed in Ethiopia, J. Hydrometeorol., 13, 338–350, 2012.
Boken, V. K., Cracknell, A. P., and Heathcote, R. L.: Monitoring and predicting agricultural drought: a global study, Oxford University Press, p. 496, https://doi.org/10.1093/oso/9780195162349.001.0001, 2005.
Brito, S. S. B., Cunha, A. P. M. A., Cunningham, C. C., Alvalá, R. C., Marengo, J. A., and Carvalho, M. A.: Frequency, duration, and severity of drought in the Semiarid Northeast Brazil region, Int. J. Climatol., 38, 517–529, 2018.
Brocca, L., Melone, F., Moramarco, T., and Morbidelli, R.: Spatial-temporal variability of soil moisture and its estimation across scales, Water Resour. Res., 46, W02516, https://doi.org/10.1029/2009WR008016, 2010.
Caloiero, T., Caroletti, G. N., and Coscarelli, R.: IMERG-based meteorological drought analysis over Italy, Climate, 9, 65, https://doi.org/10.3390/cli9040065, 2021.
Degefu, M. A. and Bewket, W.: Trends and spatial patterns of drought incidence in the omo-ghibe river basin, Ethiopia, Geogr. Ann. A, 97, 395–414, 2015.
Dembélé, M. and Zwart, S. J.: Evaluation and comparison of satellite-based rainfall products in Burkina Faso, West Africa, Int. J. Remote Sens., 37, 3995–4014, 2016.
Diem, J. E., Hartter, J., Ryan, S. J., and Palace, M. W.: Validation of satellite rainfall products for western Uganda, J. Hydrometeorol., 15, 2030–2038, 2014.
Dinku, T., Chidzambwa, S., Ceccato, P., Connor, S. J., and Ropelewski, C. F.: Validation of high-resolution satellite rainfall products over complex terrain, Int. J. Remote Sens., 29, 4097–4110, 2008.
Dinku, T., Faniriantsoa, R., Islam, S., Nsengiyumva, G., and Grossi, A.: The Climate Data Tool: Enhancing Climate Services across Africa, Front. Climate, 3, 787519, https://doi.org/10.3389/fclim.2021.787519, 2021.
Esayas, B., Simane, B., Teferi, E., Ongoma, V., and Tefera, N.: Trends in extreme climate events over three agroecological zones of southern Ethiopia, Adv. Meteorol., 1, 1–17, 2018.
Estébanez-Camarena, M., Curzi, F., Taormina, R., van de Giesen, N., and ten Veldhuis, M. C.: The Role of Water Vapor Observations in Satellite Rainfall Detection Highlighted by a Deep Learning Approach, Atmosphere, 14, 974, https://doi.org/10.3390/atmos14060974, 2023.
Feidas, H.: Validation of satellite rainfall products over Greece, Theor. Appl. Climatol., 99, 193–216, 2010.
Funk, C., Peterson, P., Landsfeld, M., Pedreros, D., Verdin, J., and Shukla, S.: The climate hazards infrared precipitation with stations—a new environmental record for monitoring extremes, Sci Data, 2, 1–21, 2015.
Gezie, M.: Farmer's response to climate change and variability in Ethiopia: A review, Cogent Food Agric., 5, 1613770, https://doi.org/10.1080/23311932.2019.1613770, 2019.
Han, Z., Huang, S., Zhao, J., Leng, G., Huang, Q., and Zhang, H.: Long-chain propagation pathways from meteorological to hydrological, agricultural and groundwater drought and their dynamics in China, J. Hydrol., 625, 130131, https://doi.org/10.1016/j.jhydrol.2023.130131, 2023.
Hordofa, T., Menkir, M., Awulachew, S. B., and Erkossa, T.: Irrigation and rain-fed crop production system in Ethiopia, impact of irrigation on poverty and environment in Ethiopia, International Water Management Institute(IWMI) Conference Papers (No. h044065), 27–36, 2008.
Kalimeris, A. and Kolios, S.: TRMM-based rainfall variability over the Central Mediterranean and its relationships with atmospheric and oceanic climatic modes, Atmos. Res., 230, 104649, https://doi.org/10.1016/j.atmosres.2019.104649, 2019.
Khalili, D., Farnoud, T., Jamshidi, H., Kamgar-Haghighi, A. A., and Zand-Parsa, S.: Comparability analyses of the SPI and RDI meteorological drought indices in different climatic zones, Water Resour. Manage., 25, 1737–1757, 2011.
Kimani, M. W., Hoedjes, J. C. B., and Su, Z.: An assessment of satellite-derived rainfall products relative to ground observations over East Africa, Remote Sens., 9, 430, https://doi.org/10.3390/rs9050430, 2017.
Legesse, S. A.: The outlook of Ethiopian long rain season from the global circulation model, Environmental Systems Research., 5, 1–16, 2016.
Levizzani, V., Amorati, R., and Meneguzzo, F.: A review of satellite-based rainfall estimation methods, European Commission Project MUSIC Report (EVK1-CT-2000-00058), 66, 2002.
Li, L., She, D., Zheng, H., Lin, P., and Yang, Z. L.: Elucidating diverse drought characteristics from two meteorological drought indices (SPI and SPEI) in China, J. Hydrometeorol., 21, 1513–1530, 2020.
Liou, Y. A. and Mulualem, G. M.: Spatio–temporal assessment of drought in Ethiopia and the impact of recent intense droughts, Remote Sens., 11, 1828, https://doi.org/10.3390/rs11151828, 2019.
Liu, X., Zhu, X., Pan, Y., Li, S., Liu, Y., and Ma, Y.: Agricultural drought monitoring: Progress, challenges, and prospects, J. Geogr. Sci., 26, 750–767, 2016.
Maidment, R., Black, E., Greatrex, H., and Young, M.: TAMSAT. Satellite Precipitation Measurement, Volume 1, 393–407, 2020.
McKee, T. B., Doesken, N. J., and Kleist, J.: The relationship of drought frequency and duration to time scales, in: Proceedings of the 8th Conference on Applied Climatology, California, 1993, Vol. 17, 22, 179–183, 1993.
Mekonen, A. A., Berlie, A. B., and Ferede, M. B.: Spatial and temporal drought incidence analysis in the northeastern highlands of Ethiopia, Geoenvironmental Disasters, 7, 1–17, 2020.
Mera, G. A.: Drought and its impacts in Ethiopia, Weather Clim Extrem., 22, 24–35, 2018.
Moges, D. M. and Bhat, H. G.: Climate change and its implications for rainfed agriculture in Ethiopia, J. Water Clim. Change, 12, 1229–1244, 2021.
Novella, N. S. and Thiaw, W. M.: African rainfall climatology version 2 for famine early warning systems, J. Appl. Meteorol. Clim., 52, 588–606, 2013.
Ntale, H. K. and Gan, T. Y.: Drought indices and their application to East Africa, Int. J. Climatol., 23, 1335–1357, 2003.
Olagunju, T. E.: Drought, desertification and the Nigerian environment: A review, Journal of Ecology and the Natural Environment, 7, 196–209, 2015.
Paulo, A. A. and Pereira, L. S.: Drought concepts and characterization: comparing drought indices applied at local and regional scales, Water Int., 31, 37–49, 2006.
Quiring, S. M.: Monitoring drought: an evaluation of meteorological drought indices, Geogr Compass., 31, 64–88, 2009.
Salimi, H., Asadi, E., and Darbandi, S.: Meteorological and hydrological drought monitoring using several drought indices, Appl. Water Sci., 11, 1–10, 2021.
Santos, L. O. F. dos, Querino, C. A. S., Querino, J. K. A. da, S., Pedreira Junior, A. L., Moura, A. R. de, M., and Machado, N. G.: Validation of rainfall data estimated by GPM satellite on Southern Amazon region, Revista Ambiente & Água., 14, https://doi.org/10.4136/ambi-agua.2249, 2018.
Shalishe, A., Bhowmick, A., and Elias, K.: Meteorological Drought Monitoring Based on Satellite CHIRPS Product over Gamo Zone, Southern Ethiopia, Adv. Meteorol., 1, 9323263, https://doi.org/10.1155/2022/9323263, 2022.
Shawky, A. I. and Bakoban, R. A.: Exponentiated gamma distribution: Different methods of estimations, J. Appl. Math., 1, 284296, https://doi.org/10.1155/2012/284296, 2012.
Stampoulis, D. and Anagnostou, E. N.: Evaluation of global satellite rainfall products over continental Europe, J. Hydrometeorol., 13, 588–603, 2012.
Tadesse, K. E., Melesse, A. M., Abebe, A., Lakew, H. B., and Paron, P.: Evaluation of global precipitation products over wabi shebelle river basin, Ethiopia, Hydrology, 9, 66, https://doi.org/10.3390/hydrology9050066, 2022.
Tan, M. L., Gassman, P. W., and Cracknell, A. P.: Assessment of three long-term gridded climate products for hydro-climatic simulations in tropical river basins, Water, 9, 229, https://doi.org/10.3390/w9030229, 2017.
Tarnavsky, E., Grimes, D., Maidment, R., Black, E., Allan, R. P., and Stringer, M.: Extension of the TAMSAT satellite-based rainfall monitoring over Africa and from 1983 to present, J. Appl. Meteorol. Clim., 53, 2805–2822, 2014.
Tobin, K. J. and Bennett, M. E.: Satellite precipitation products and hydrologic applications, Water Int., 39, 360–380, 2014.
Van Loon, A. F.: Hydrological drought explained, Wiley Interdisciplinary Reviews: Water, 2, 359–392, 2015.
Vicente-Serrano, S. M, Quiring, S. M., Pena-Gallardo, M., Yuan, S., and Dominguez-Castro, F.: A review of environmental droughts: Increased risk under global warming?, Earth Sci. Rev., 201, 102953, https://doi.org/10.1016/j.earscirev.2019.102953, 2020.
Viste, E., Korecha, D., and Sorteberg, A.: Recent drought and precipitation tendencies in Ethiopia, Theor. Appl. Climatol., 112, 535–551, 2013.
Wakjira, M. T., Peleg, N., Anghileri, D., Molnar, D., Alamirew, T., and Six, J.: Rainfall seasonality and timing: implications for cereal crop production in Ethiopia, Agr. Forest Meteorol., 310, 108633, https://doi.org/10.1016/j.agrformet.2021.108633, 2021.
Wilhelmi, O. V. and Wilhite, D. A.: Assessing vulnerability to agricultural drought: a Nebraska case study, Nat. Hazards, 25, 37–58, 2002.
Wilhite, D. A. and Buchanan-Smith M.: Drought as hazard understanding the natural and social context, Drought and water crises: Science, technology, and management issues, 3–29, CRC Press, Boca Raton, FL, 3–29, 2005.
Wilson, D. J., Western, A. W., and Grayson, R. B.: Identifying and quantifying sources of variability in temporal and spatial soil moisture observations, Water Resour Res., 40, W02507, https://doi.org/10.1029/2003WR002306, 2004.
Wiwoho, B. S., Astuti, I. S., Alfarizi, I. A. G., and Sucahyo, H. R.: Validation of three daily satellite rainfall products in a humid tropic watershed, Brantas, Indonesia: implications to land characteristics and hydrological modelling, Hydrology, 8, 154, https://doi.org/10.3390/hydrology8040154, 2021.
Worqlul, A. W., Yen, H., Collick, A. S., Tilahun, S. A., Langan, S., and Steenhuis, T. S.: Evaluation of CFSR, TMPA 3B42 and ground-based rainfall data as input for hydrological models, in data-scarce regions: The upper Blue Nile Basin, Ethiopia, Catena, 152, 242–251, 2017.
Yigezu, W. G.: The challenges and prospects of Ethiopian agriculture, Cogent Food Agric., 7, 1923619, https://doi.org/10.1080/23311932.2021.1923619, 2021.
Yihdego, Y., Vaheddoost, B., and Al-Weshah, R. A.: Drought indices and indicators revisited, Arab. J. Geosci., 12, 1–12, 2019.
Young, M. P., Williams, C. J. R., Chiu, J. C., Maidment, R. I., and Chen, S. H.: Investigation of discrepancies in satellite rainfall estimates over Ethiopia, J. Hydrometeorol., 15, 2347–2369, 2014.
Zambrano-Bigiarini, M., Nauditt, A., Birkel, C., Verbist, K., and Ribbe, L.: Temporal and spatial evaluation of satellite-based rainfall estimates across the complex topographical and climatic gradients of Chile, Hydrol. Earth Syst. Sci., 21, 1295–1320, https://doi.org/10.5194/hess-21-1295-2017, 2017.
Zargar, A., Sadiq, R., Naser, B., and Khan, F. I.: A review of drought indices, Environ. Rev., 19, 333–349, 2011.