the Creative Commons Attribution 4.0 License.
the Creative Commons Attribution 4.0 License.
 | 20 Jan 2021
Copula approach for simulated damages caused by landfalling US hurricanes
Thomas Patrick Leahy
Hurricanes are destructive forces of nature that have the ability to cause vast devastation both economically and socially. Estimating the potential damage caused by hurricanes aids local, state and federal governments as well as insurance and reinsurance companies to plan for future hurricanes. Direct damages caused by hurricanes are difficult to estimate. There are multiple factors that could contribute to the damages caused by a hurricane. Wind is typically considered the most important factor to account for when estimating potential damage. Aside from the complex physical processes, the difficultly in estimating hurricane damages is further compounded by limited data and a changing climate. Fitting models with limited data presents a series of challenges. These challenges include outliers that could form a large proportion of the data, overfitting, missing data and it becomes difficult to leave out a portion of the data for external validation.
This study found a significant positive correlation using the Kendall rank correlation coefficient between hurricane damages, measured by the area of total destruction and the maximum landfalling wind speed (τ = 0.451). A copula-based approach was used to model their dependency. Both bivariate Archimedean and elliptical copulae families were assessed as potential models. A bivariate Frank copula with Weibull marginals was found to be the most appropriate fitting model based on a visual inspection of the contour plots of the fitted copulae. Simulation from the fitted copula was qualitatively similar to observation. This study demonstrated a potential method to overcome the limitation of small data facing models to estimate hurricane damages.
- Article
(968 KB) - Full-text XML
- BibTeX
- EndNote


Hurricanes are extreme forces of nature that have the potential to cause vast destruction and devastation. They are fast-moving, structured, rotating air masses with a low-pressure centre. Hurricanes, also known as tropical cyclones, are characterised by strong winds that spiral in an asymmetric shape producing thunderstorms and heavy rain bands (Leahy, 2019). Hurricanes have a unique ability to cause widespread damage in multiple forms, including destruction from strong winds, heavy rainfall, possibly a highly destructive storm surge as well as spawning tornadoes. In 2019, there was an estimated USD 22 billion of damage caused directly from hurricanes in the United States (Roach, 2020). The majority of this damage was caused by Hurricane Dorian, which in August 2019 made landfall in the US Virgin Islands. Dorian was classified as a category-5 hurricane and became the strongest hurricane to impact the north-western Bahamas since records began, all within a week of just being a developing low-pressure system (The Weather Channel, 2020; Zegarra et al., 2020).
There is significant interest in trying to predict the future trend of hurricanes in light of global climate change, in particular to the risk that hurricanes pose to hurricane-prone coastal and in-land areas. The change in the frequency of hurricanes under a warming climate is debated. Many studies agree that the frequency globally is set to decrease (Murakami and Sugi, 2010); however there is a distinct lack of confidence in projected frequencies for individual basins. For example, in the western North Pacific (WNP), the most active hurricane basin, simulations conducted in Emanuel et al. (2008) and Zhang et al. (2017) indicated that tendency toward increased frequency of tropical cyclone events. In contrast, other studies have shown that significant decreases in the number of cyclones are expected in the future in the WNP (Knutson et al., 2010; Murakami et al., 2012). This uncertainty is not limited to the WNP; in the North Atlantic, studies have projected future changes in frequency between −60 % and +60 % (Msadek et al., 2013). As a result, this uncertainty propagates into further ambiguity toward projected damages from future hurricanes.
Approaches to estimate damages caused from hurricanes are an active area of research and have varied in approach. One of the most important features with respect to hurricane damage estimation is the comparability of estimates over time. For example, damages caused during the active hurricane period in the 1880s cannot be directly compared to damages in the past decade due to the increase in property and infrastructure exposure. To overcome this, damage records are normalised in order to make events over time comparable. There are several approaches in which damages can be normalised, each accounting for different aspects of differing exposure. One set of approaches focuses on adjusting for inflation, a wealth adjustment factor and a coastal population factor (Pielke et al., 2008; Pielke and Landsea, 1998; Weinkle et al., 2018). Other approaches normalise by taking regression approaches and accounting for socioeconomic factors and insurance factors (Barthel and Neumayer, 2012; Estrada et al., 2015; Schmidt et al., 2009, 2010). A more recent approach was developed that accounts for spatial differences in exposure as well as accounting for increase in wealth and population (Grinsted et al., 2019).
Modelling the wind damage caused by hurricanes has been studied extensively. The majority of studies modelling damages caused by hurricanes have focused on estimating the wind–damage elasticity (Bouwer and Wouter Botzen, 2011; Hsiang and Narita, 2012; Mendelsohn et al., 2012; Nordhaus, 2010; Schmidt et al., 2010; Strobl, 2012). This parameter links tropical cyclone wind speeds and economic damages. Another approach examined the impact of the size of hurricanes on damages (Zhai and Jiang, 2014). More recently, a study investigated the impact of hurricane rainfall on damages (Bakkensen et al., 2018). The availability of sufficient data to model hurricane damages inhibits the accuracy of these models (Hamid et al., 2010). For example, in one study investigating the impact on hurricane damages in the Caribbean, there were 238 hurricane-related disasters. However, only 140 of these had information on damages (Mejia, 2016). In another study, only 73 hurricanes had sufficient data in which to model the impact on damages (Zhai and Jiang, 2014).
In this study, a copula-based approach was explored to model the dependency between estimated hurricane damages and maximum hurricane wind speed at landfall in the United States. Additionally, an exploratory analysis of historical damages was performed as well as a correlation analysis between hurricane damages and maximum landfalling wind speed. In the remainder of this article the data and methodology that were used are described respectively. Then the results and further discussion and conclusion are provided.
The damage data used in this study were obtained from Grinsted et al. (2019). The data ranged from 1900 to 2017 and were comprised of several variables including the area of total destruction (ATD), the US state where landfall occurred and the hurricane wind speed at landfall. The landfall location and hence landfall state as well as the wind speed recorded at landfall were obtained from the International Best Track Archive for Climate Stewardship (IBTrACS) (Knapp et al., 2010). Data quality in the IBTrACS can vary based on a number of factors. Pre-1980, there was no geostationary satellite coverage and this period was also pre-digital record; therefore wind speed and location recordings could be subject to uncertainty. In the pre-1950 period, this was before both satellites and radar and observations were generally limited to ships and land-based observations. However, there has been a significant effort in reanalysing historical hurricane records (Knapp, 2016).
The ATD is an alternative approach to measuring hurricane damages as opposed to economic or monetary loss. It has been demonstrated that the approach of using ATD over other more traditional measures of loss, such as normalised damage, has reduced the variability of normalised historical records (Grinsted et al., 2019). The ATD for landfall i is calculated as
where Ωi is the landfall region, Bi is the economic base damage and W(ti,Ωi) is the estimated wealth in region Ωi at time ti for landfalling hurricane i (Grinsted et al., 2019). The calculation in Grinsted et al. (2019) uses a fixed distance from the landfall location that has an area of 10 000 km2 land-covered points for Area(Ωi). As a result, the population in the 10 000 km2 land-covered area using the approach in Fang and Jawitz (2018) and the wealth per capita are obtained to calculate W(ti,Ωi). Base damage estimates (Bi) were compiled by Pielke et al. (2008) and updated by the ICAT insurance company (Grinsted et al., 2019).
To measure the correlation between the ATD and landfalling wind speed, the Kendall rank correlation coefficient (or Kendall's tau coefficient) was used (Kendall, 1938). The traditional Pearson correlation coefficient was not sufficient, since the correlation structure between the ATD and landfalling wind speed was unknown and not necessarily linear. Kendall's tau is a non-linear rank-based correlation coefficient that is often used as a test statistic in a hypothesis test. A hypothesis test of this type makes no distributional assumptions (Kendall, 1938). The Kendall's tau coefficient is defined as
where NC and ND are the number of concordant and discordant pairs respectively, and the denominator is the binomial coefficient, where N is the total number of pairs. Similar to the Pearson correlation coefficient, . A hypothesis test was applied to test if correlations were significant, where the null hypothesis is that the variables are uncorrelated.
To fit a parametric distribution to the marginal distributions, a maximum likelihood approach was used (Delignette-Muller and Dutang, 2015). An initial exploratory analysis was conducted assessing the shape of the observed data, and suitable candidate distributions were selected as potential models for the marginal variables. Four distributions were considered candidate distributions to model ATD, namely exponential, log-normal, gamma and Weibull distributions. For the wind speed at landfall variable, the normal, log-normal, gamma and Weibull distributions were considered candidate models. Goodness of fit for the marginal distributions was assessed by the Akaike information criterion (AIC) (Akaike, 1974) and the Bayesian information criteria (BIC) (Schwarz, 1978).
Copulae are functions that enable separation of the dependency structure and the marginal distributions of multivariate distributions. Copulae have many attractive features that make them useful and interpretable such as invariance (Nelsen, 2007). A copula can be formally defined as follows (Nelsen, 2007; Sklar, 1973, 1959):
Definition 1. is a d-dimensional copula if C is a joint cumulative density function (CDF) of a d-dimensional random vector on the unit cube [0,1]d with uniform margins.
In this study, six families of copulae as used, namely Gumbel, Frank, Clayton, Joe, normal and Student t (Table 1). The Gumbel, Frank, Clayton and Joe copulae are known as Archimedean copulae and are the most popular class of copulae. One advantage of Archimedean copulae is that they can be easily deduced, but the limitation is that the definition does not extend to a multivariate data set of n dimensions since there will be multiple values of tau (τ) for each pair of marginal variable. The normal and Student-t copulae are known as elliptical copulae, since they are copulae of elliptically contoured distributions. Two disadvantages of elliptical copulae is that they typically do not have a closed form expression and are restricted to have radial symmetry. However, one key advantage of elliptical copulae is that one can specify different levels of correlation between marginal variables.
Table 1Six bivariate copula families.
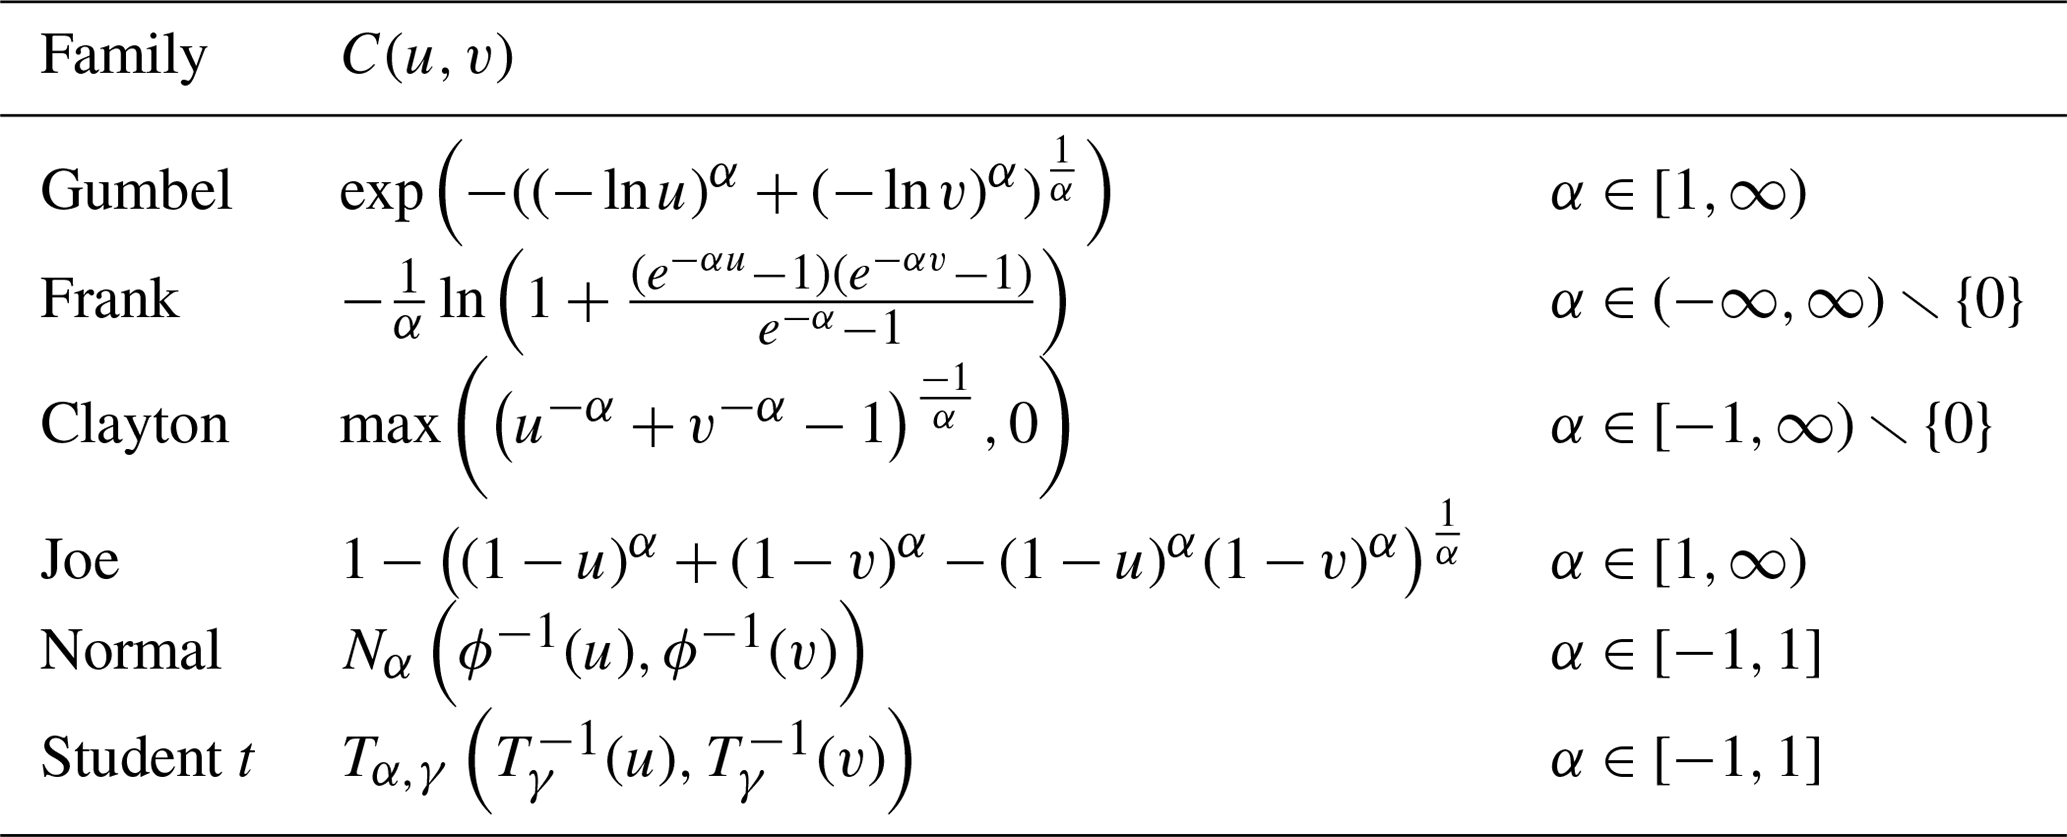
Nα – CDF of a standard bivariate normal distribution with Pearson correlation α. ϕ – CDF of a N(0,1). Tγ – CDF of a Student distribution with γ degrees of freedom. Tα,γ – CDF of a bivariate Student distribution with γ degrees of freedom.
The copulae given in Table 1 have varying tail dependence structures from each other. The concept of tail dependence relates to the measure of comovement of random variables in the tails of their respective distributions. This can be defined as follows (Joe, 1997):
Definition 2. If a bivariate copula C is such that
exists, with , then the copula C has an upper tail dependence if and no upper tail dependence if λU=0. Similarly, if a bivariate copula C is such that
exists, then the copula C has lower tail dependence if and no lower tail dependence if λL=0.
The Gumbel and Joe copulae both have upper tail dependence, whereas the Clayton copula has lower tail dependence. The Student-t copula can capture upper or lower tail dependence if it exists, whereas the normal copula is tail independent, even if there is a strong correlation between random variables (AghaKouchak et al., 2012).
Goodness of fit of the fitted copulae was assessed by a visual comparison of the contour plots of the densities of the fitted copulae and a contour plot of a non-parametric kernel density estimate of the observed data. In addition, as a supportive analysis to determining the goodness of fit, the Cramér–von Mises functional Sn test statistic is calculated for all fitted copulae comparing the empirical copula with a parametric estimate of the copula derived under the null hypothesis (Genest et al., 2009). The Cramér–von Mises functional test statistic is defined as
where Cn(u) is the empirical copula and ℂn is a measure of distance between Cn and an estimation of C obtained under the null hypothesis (Genest et al., 2009). The test is implemented using multiplier bootstrap approach with 50 replications.
All analyses were completed using R version 3.5.2 and the copula package (Hofert et al., 2020).
In the United States between 1900 and 2017, there were 247 landfalling hurricanes reported in Grinsted et al. (2019). Of these, 19 hurricanes reported to have ≤1 km2 ATD; these were removed from the study, resulting in 229 hurricanes in the analysis. Annual hurricane damage has varied significantly over time with 2017 having the most damage of 14 170 km2. Hurricane Harvey contributed the most damage in 2017. It made landfall in August 2017 in Texas, causing an estimated 11 835 km2 in damage. The mean and median damage over the study period were 444.95 and 84.7 km2 respectively. The mean annual number of landfalling hurricanes that had an ATD>1 km2 was 2.09 over the entire study period. The annual mean landfalling maximum wind speed varied significantly over time; the mean over the entire study period was 70.26 kn. The distribution of landfalling wind speed and the ATD is shown in Fig. 1. The top five most destructive storms over the study period are ranked in Table 2.
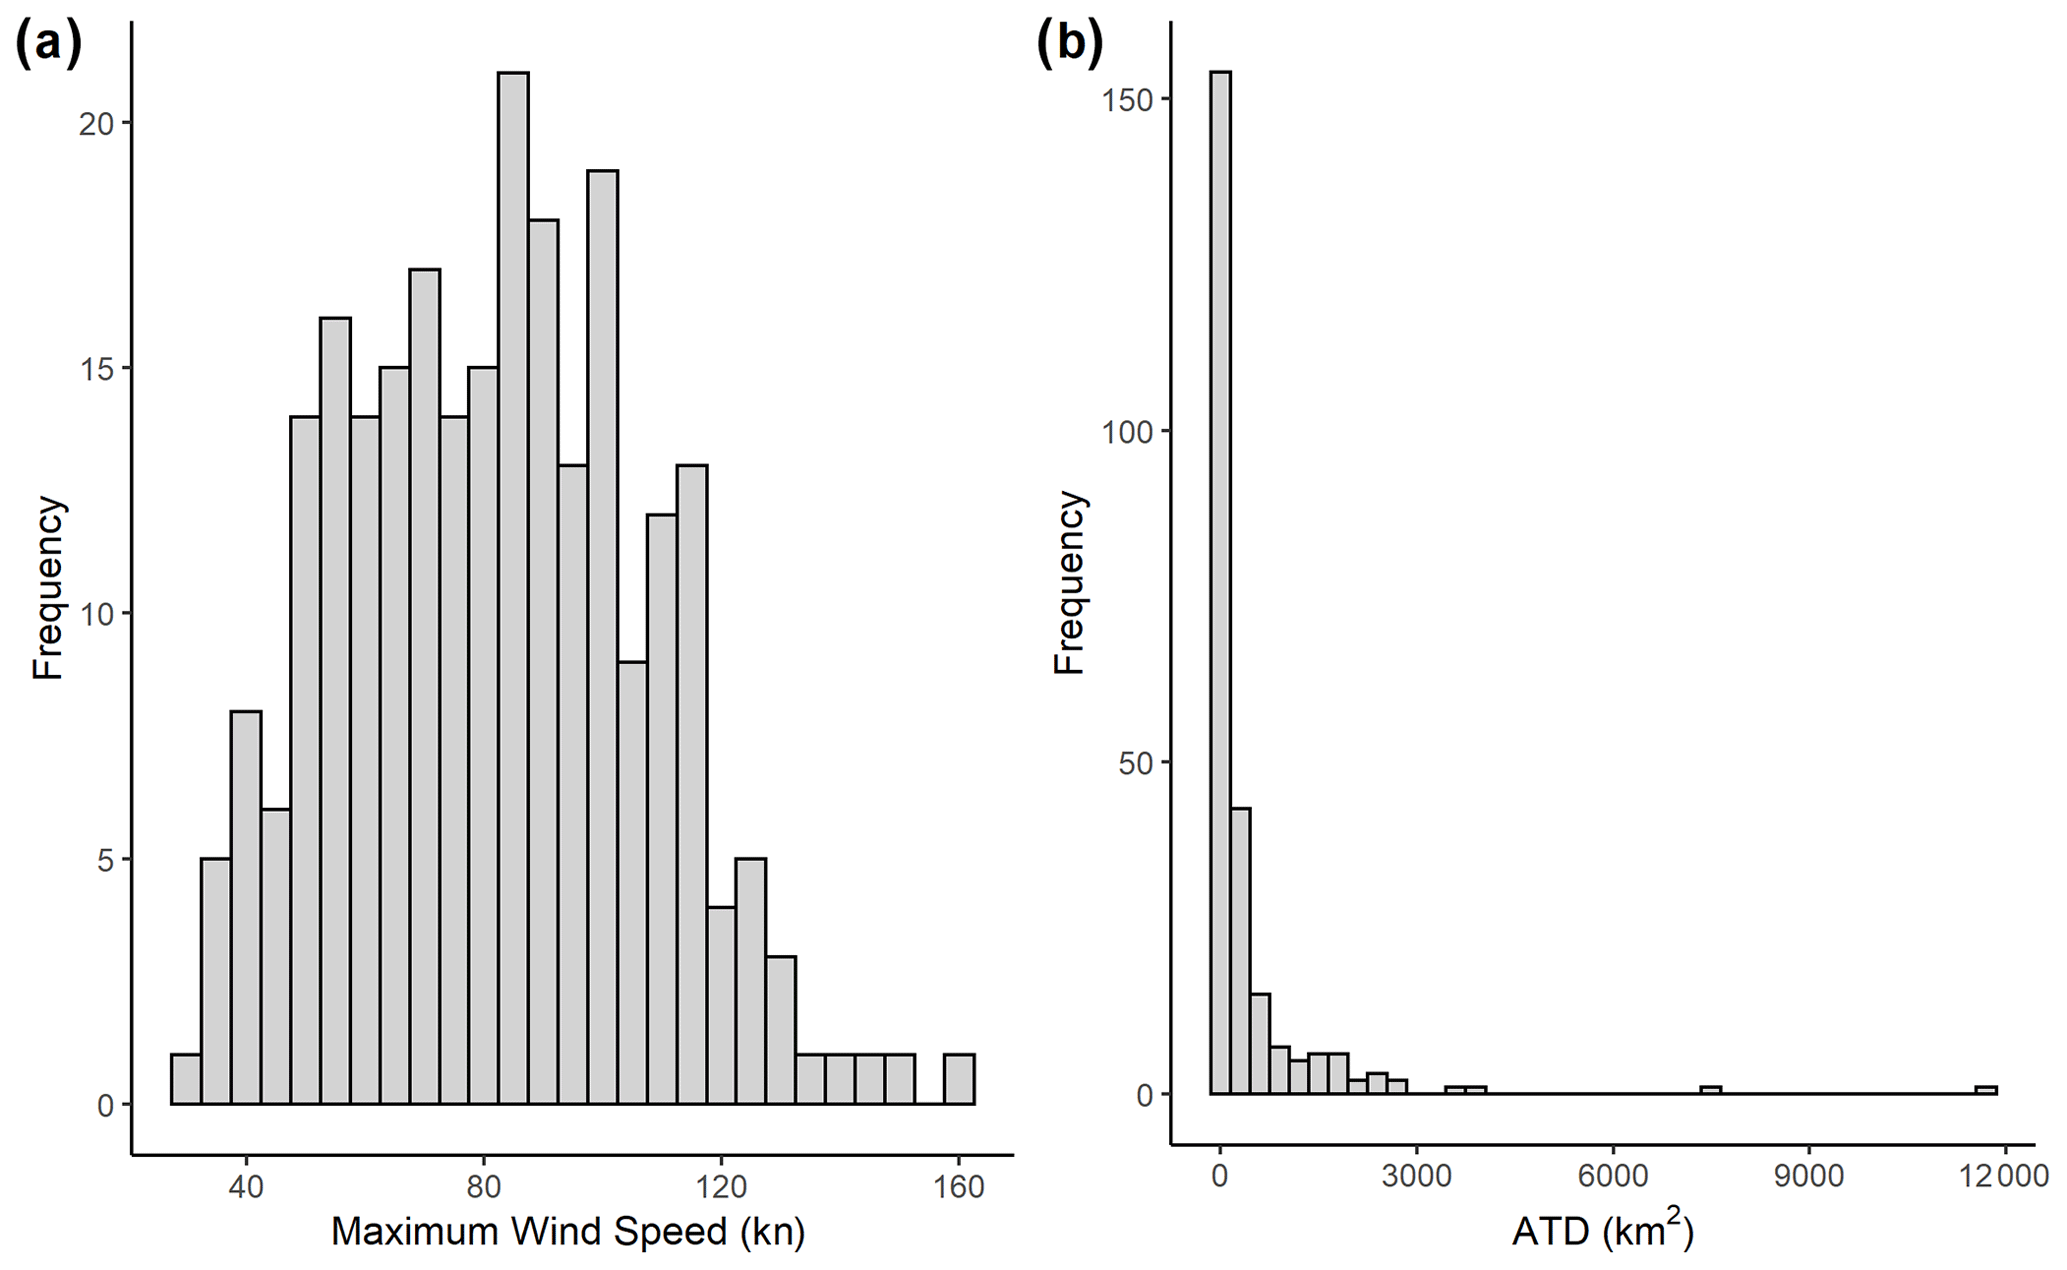
Figure 1(a) Histogram of maximum landfalling wind speed and (b) histogram of area of total destruction (ATD).
Table 2Summary of the most destructive hurricanes that made landfall in the United States between 1900 and 2017 as defined by their respective ATD.
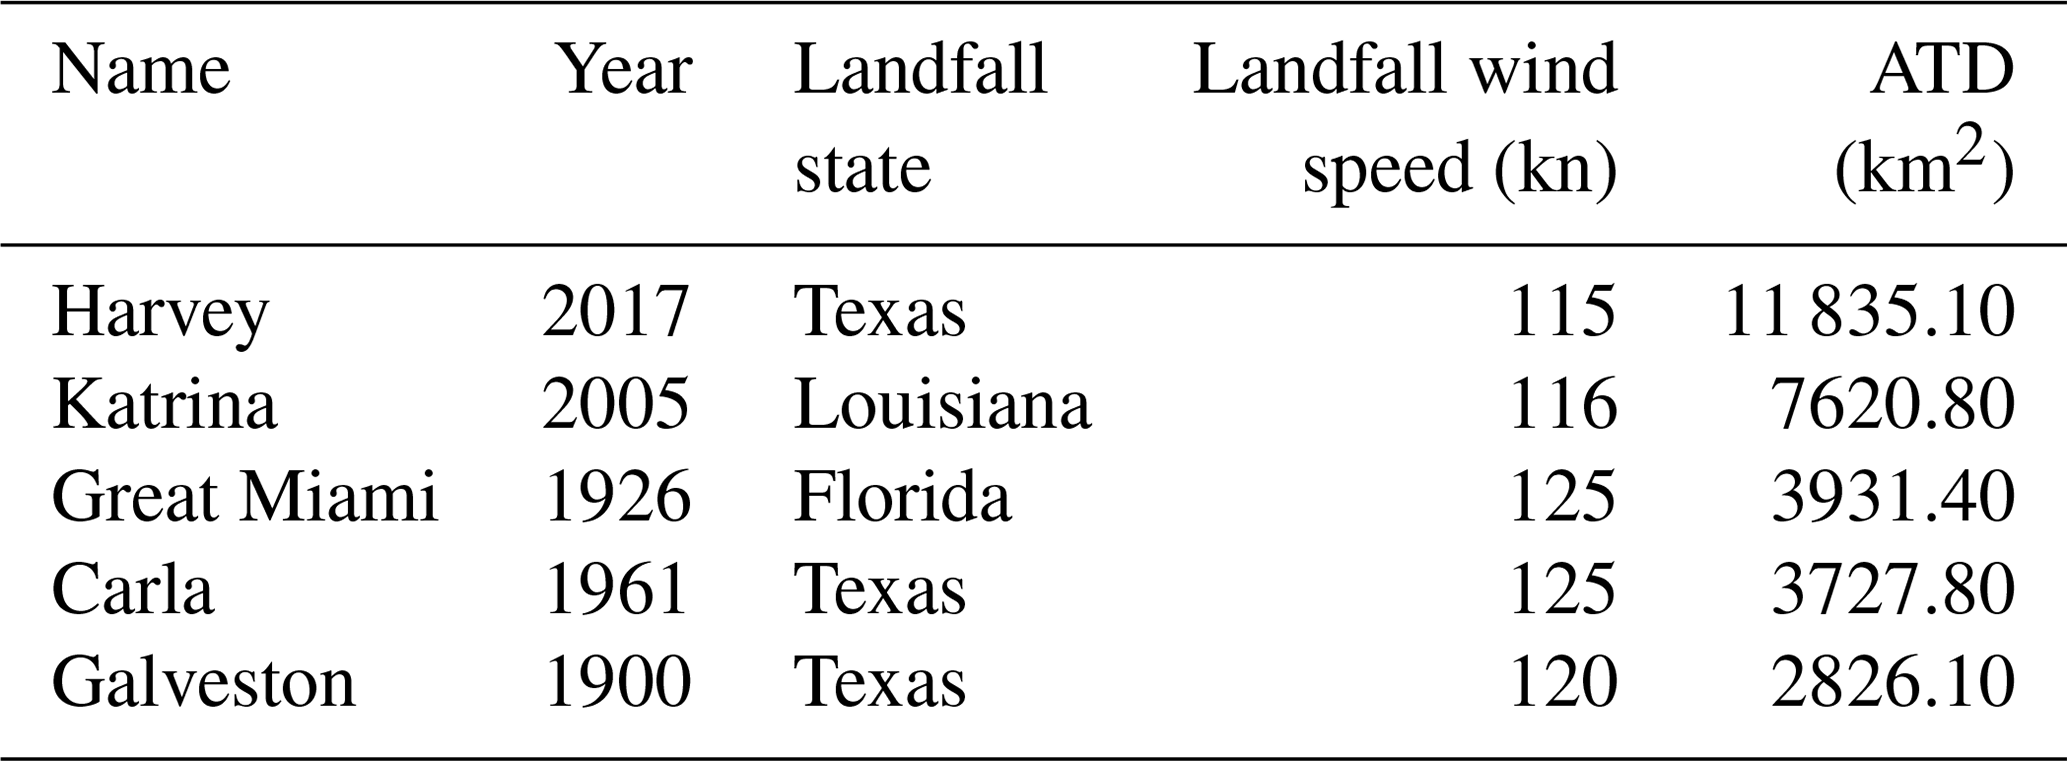
Figure 2 shows a map of hurricane landfalls between 1900–2017 included in this study. For each landfall location, the ATD is plotted as the relative size of the landfall and the wind speed measured in knots is also shown by the colour of the landfall location. From a visual inspection, it appeared that the ATD is related to larger metropolitan areas. Additionally, there was no obvious latitudinal dependence of the wind speed at landfall. To quantify this observation, a two-sided, two-sample difference of means t test was conducted between the mean landfall wind speeds above and below 30∘ N. The 30∘ N latitudinal cut-off was selected as it is centred around the bulk of the landfall locations. The mean landfall wind speed below 30∘ N was 82.58 kn and above 30∘ N was 80.54 kn, which resulted in a p value of 0.516. Therefore at the 95 % confidence level the null hypothesis cannot reject that there was no difference between the mean landfall wind speeds. As a sensitivity, the test was repeated at 28∘ N also resulting in an insignificant difference between the mean landfall wind speeds (pvalue=0.09). The Pearson correlation coefficient between landfall latitude and landfall wind speed was .
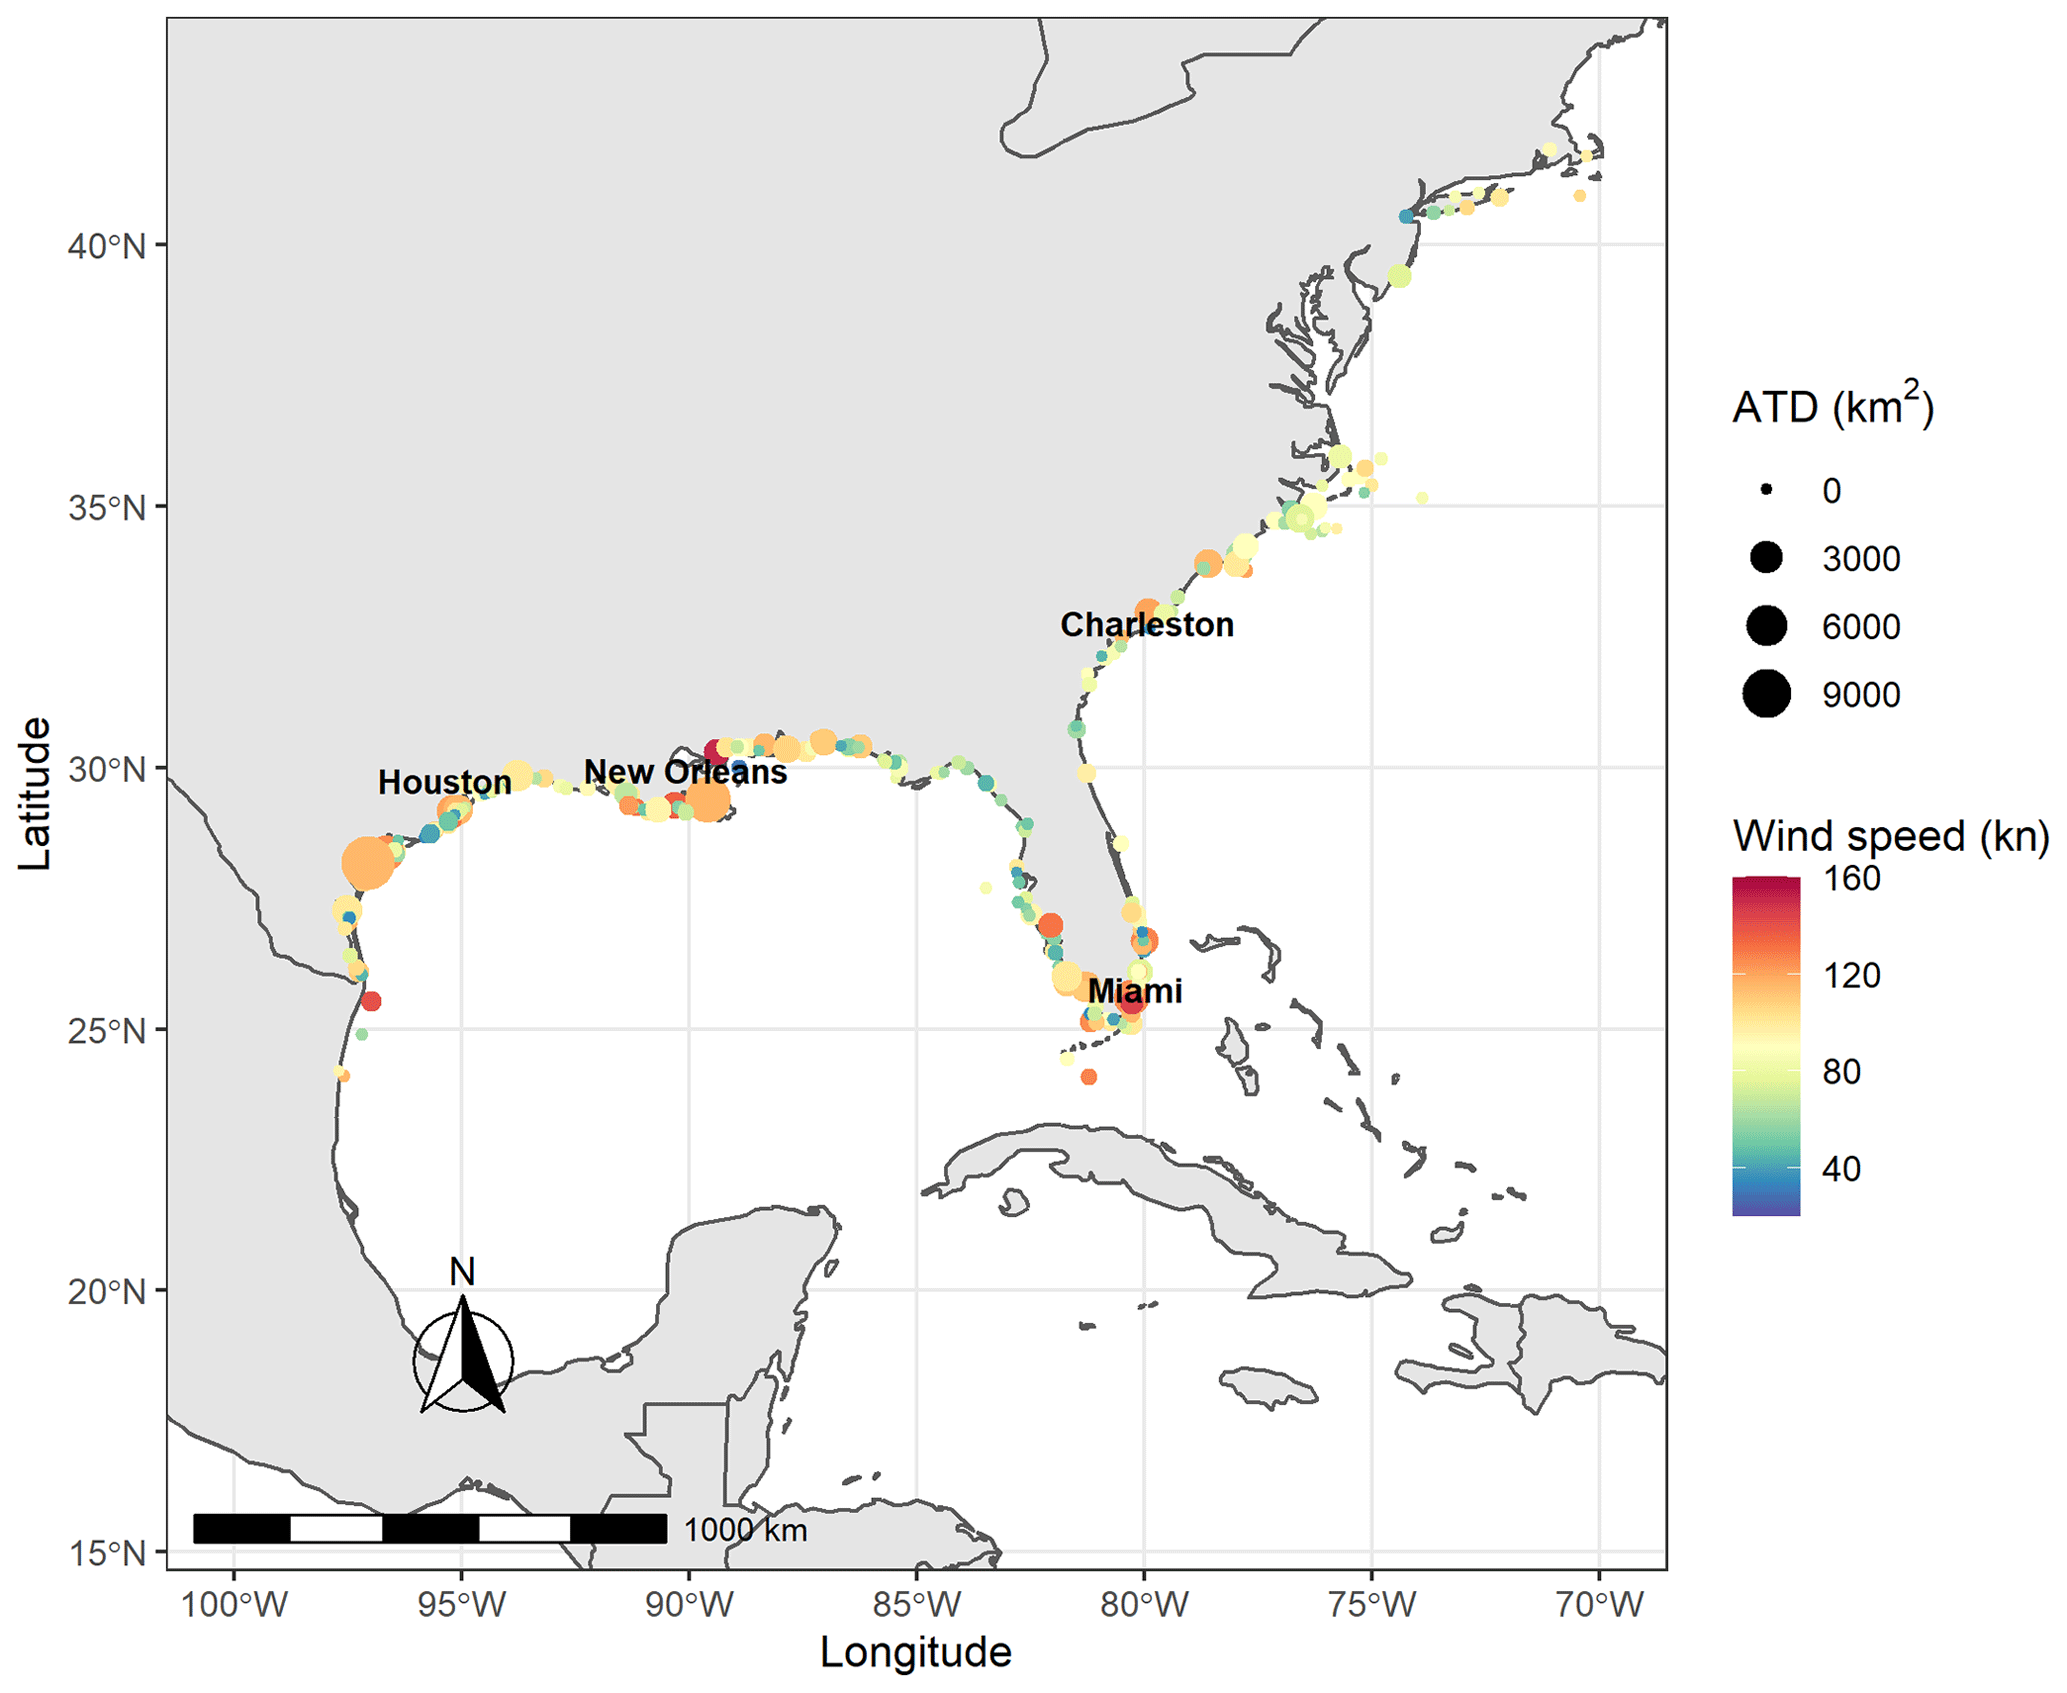
Figure 2Map of hurricane landfall locations 1900–2017 with corresponding wind speed (kn) and area of total destruction (ATD).
Damage caused by hurricanes was not uniformly distributed among the eastern seaboard states. In Fig. 3, total damages are stratified by landfalling state for 1900–1940, 1941–1980 and 1981–2017 study periods. Texas and Florida were the two states that had sustained the most damage over the study period. The mean damages were 2828.51, 2570.1 and 5055.83 km2 over the three time periods 1900–1940, 1941–1980 and 1981–2017 respectively. These results and those presented in Fig. 3 assume that all damage caused was to the landfall state.

Figure 3The area of total destruction (ATD) by landfalling state over the periods 1900–1940, 1941–1980 and 1981–2017 indicated by varying symbols and blue and red symbols showing ATD below and above the overall mean ATD respectively.
Table 3Kendall correlation coefficients between the ATD and maximum landfalling wind speed stratified by time period and wind speed category with corresponding p values.
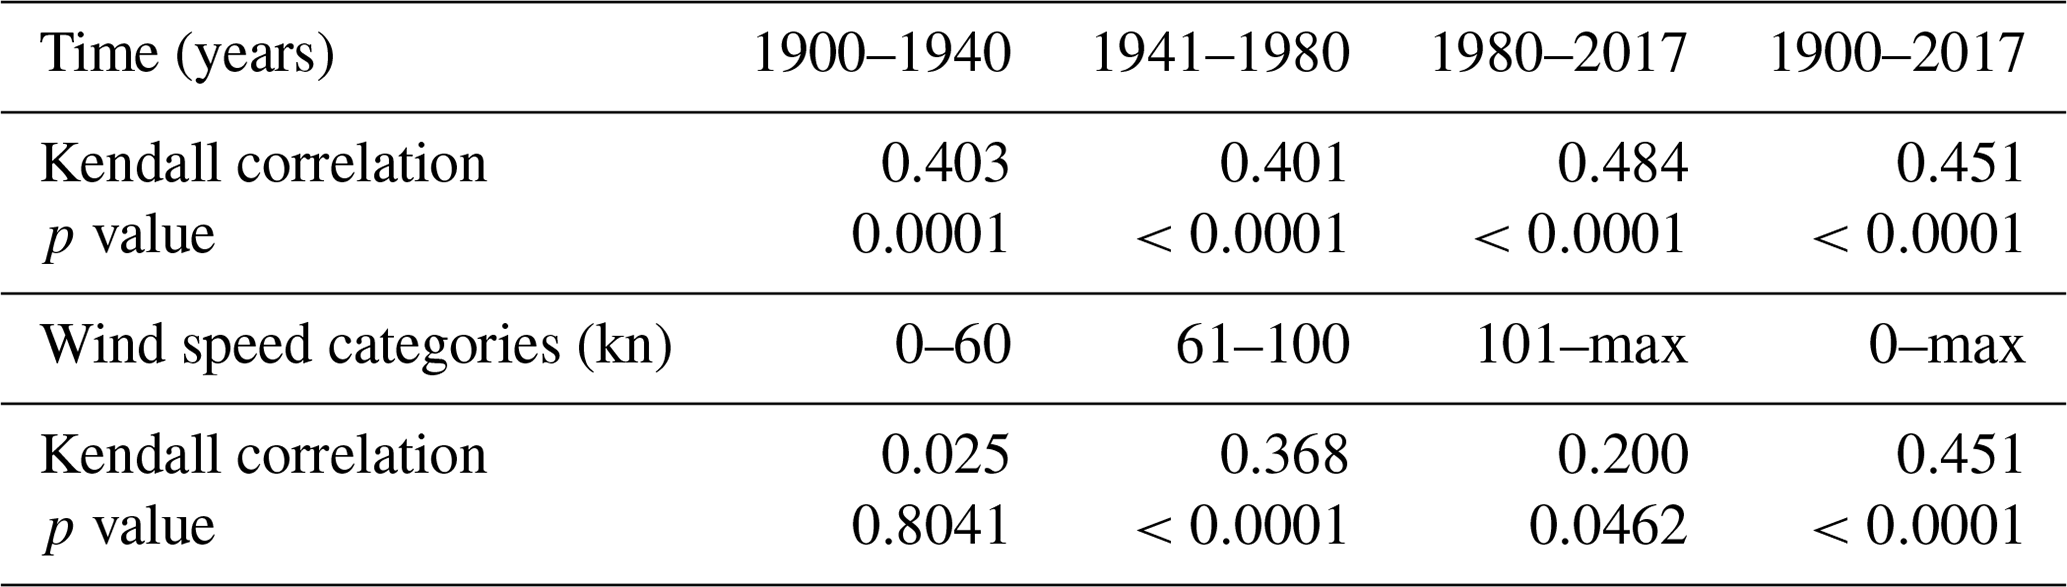
The distribution of ATD is highly right-skewed with a value of 6.71. This is also apparent from Fig. 1b. The distribution of ATD appeared to be heavy-tailed, and therefore the log-transform was applied to the ATD distribution. The logarithmic transformation of the data preserves the correlation and is invertible. The skewness of the landfalling wind speed distribution was 0.23, which indicated a relatively symmetric distribution.
There was a significant positive correlation between the log-transformed ATD and the landfalling hurricane wind speed (Kendall correlation coefficient 0.451, pvalue<0.0001). Correlation between the ATD>1 km2 and the landfalling wind speed was calculated stratified by three time periods and three strength categories. This correlation analysis approach was used to examine if the correlation was consistent over time and for landfall wind strength (Table 3). Correlations over time with the ATD were similar but vary much more with the landfalling maximum wind speed, with no significant correlation among the lower landfalling wind speeds. There was a lower correlation (τ=0.20) between the landfall wind speed in the higher category (52 hurricanes) with ATD compared to the middle category. In the higher wind speed category, there are various possible reasons why the correlation may be smaller in magnitude. For example, early warnings may have indicated the potential severity of the storm, and as a result there was an increase in preparedness. Also the damage caused is most likely dependent on the land use for example metropolitan or rural areas. However, this is beyond the scope of this study.
Table 4Marginal distribution goodness-of-fit AIC and BIC measures for log-transformed ATD and maximum landfalling wind speed and smallest values highlighted in bold.
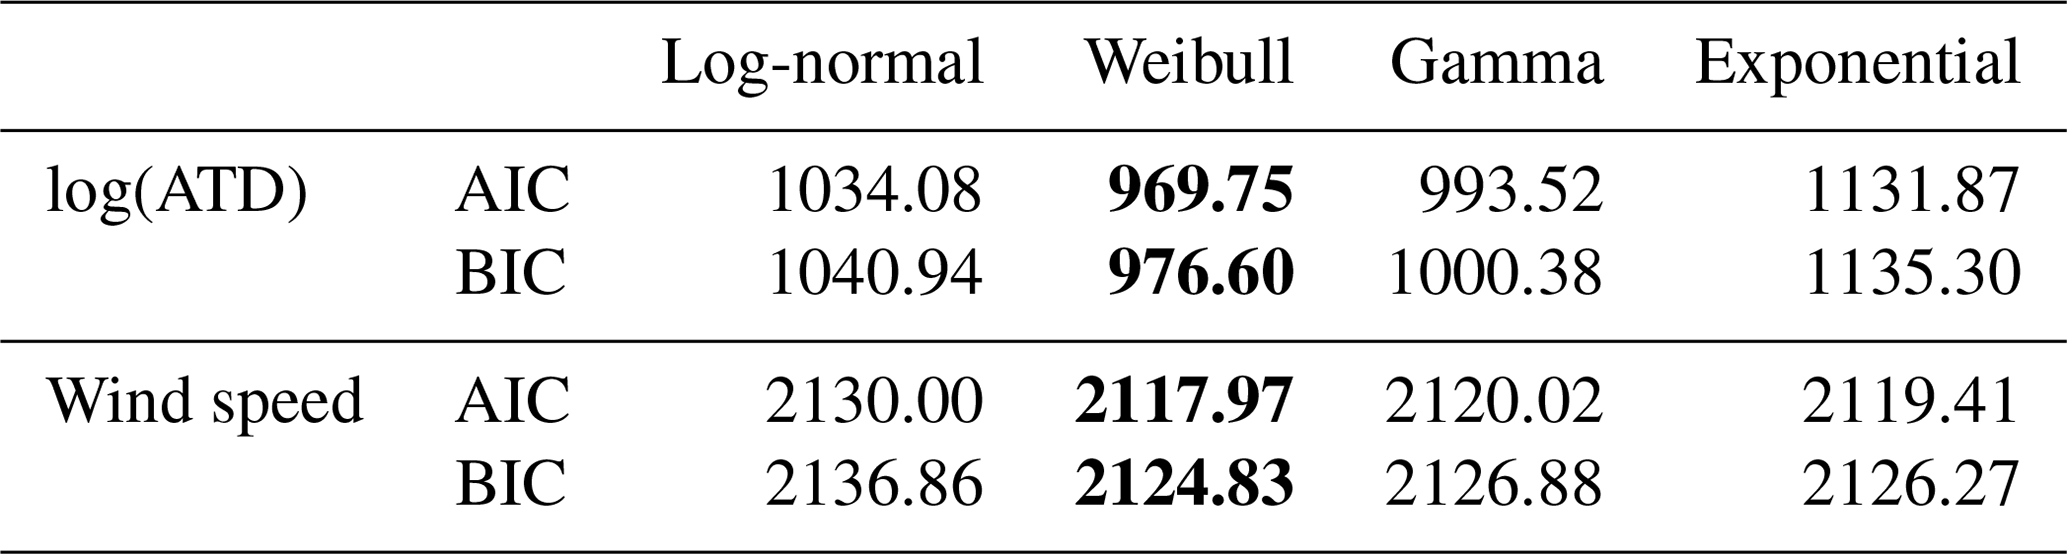
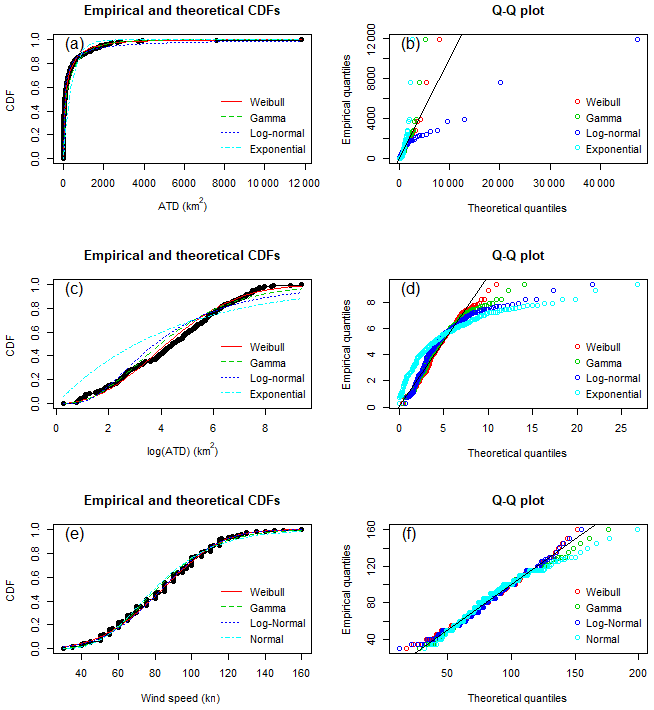
Figure 4Empirical and theoretical cumulative distribution functions (CDFs) of the fitted distributions for (a) the area of total destruction (ATD) on the original scale, (c) the log-transformed ATD and (e) the landfalling wind speed. Quantile–quantile (Q–Q) plots of the fitted distributions for (b) ATD on the original scale, (d) the log-transformed ATD and (f) the landfalling wind speed.
Weibull, gamma, log-normal and exponential distributions were fit to the log-transformed marginal distributions of ATD; Weibull, gamma, normal and log-normal distributions were fit to the landfalling wind speed marginal distribution. The AIC and BIC measures of goodness of fit are reported in Table 4 for the respective marginal distributions. For both the log-transformed ATD and landfalling wind speed distributions, the Weibull distribution resulted in the lowest AIC and BIC. For the log-transformed ATD, the Weibull AIC and BIC were significantly smaller compared to other fitted distributions. Differences in the AIC and BIC of fitted distributions for the landfalling wind speed were similar; however, the Weibull distribution had the smallest values in both AIC and BIC overall. In addition, to confirm the selection of the marginal distributions, the empirical and theoretical cumulative distribution functions (CDFs) and the quantile–quantile (Q–Q) plots were plotted of the fitted distributions (Fig. 4). The plots showed that for the log-transformed ATD, the Weibull distribution captured the estimated CDF and upper quantiles of the data better than the other fitted distributions. The comparison of the CDFs and Q–Q plot showed that the gamma and normal distributions were the least well-fitting distributions of the landfalling wind speed data (Fig. 4). The performances of the log-normal and Weibull distributions were similar in modelling the landfalling wind speed distributions, and so the distribution with the smallest AIC/BIC value was selected. Therefore, the marginal distributions of the bivariate copula were modelled as Weibull.
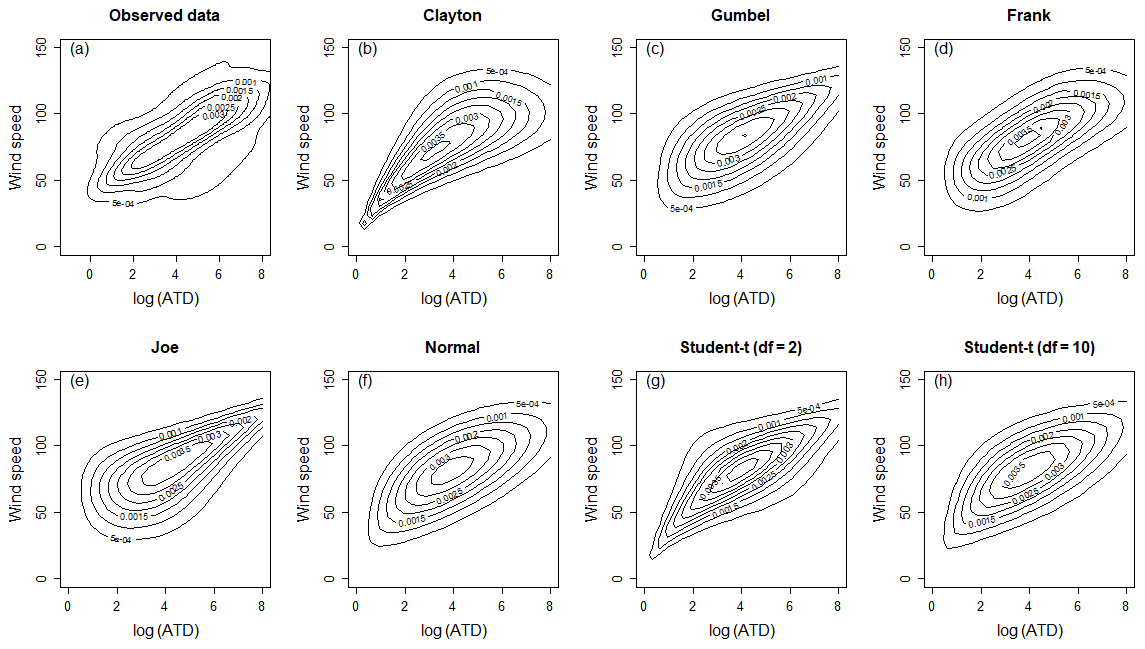
Figure 5Contour plot of the kernel density estimate of the observed data is shown in (a). The contour plot of the fitted bivariate copulae for the (b) Clayton, (c) Gumbel, (d) Frank, (e) Joe, (f) normal, (g) Student t with 2 degrees of freedom, and (h) Student t with 10 degrees of freedom distributions. Landfalling wind speed measured in knots is given on the y axis, and log-transformed area of total destruction (ATD) is given on the x axis.
Bivariate copulae were fit to the log-transformed ATD and maximum landfalling wind speed. Goodness of fit was assessed by comparing the contour plot of the kernel density estimate of the observed data with the contour plots of the fitted copulae (Fig. 5). From Fig. 5a, it is clear that the density of the observed data is symmetric and that there is no obvious lower or upper tail dependence. Therefore, the Gumbel and Joe copulae with their upper tail dependence and the Clayton copula with its lower tail dependence were removed from consideration to model the bivariate dependency structure. Similarly, the Student-t copula with 2 degrees of freedom was not considered a suitable model due to its tail dependence structure. Of the remaining fitted copulae, it was determined that the Frank copula with α=4.91 was the most suitable bivariate copula to jointly model the dependence structure between the log-transformed ATD and the landfalling wind speed. In addition to the visual comparison of between the Frank, normal and Student-t copula with 10 degrees of freedom, the AIC and BIC values were calculated. The AIC values for the Frank, normal and Student-t copula with 10 degrees of freedom were −105.3, −90.48 and −89.16, and similarly the BIC values were calculated as −101.88, −87.05 and −82.3 respectively, confirming that the Frank copula with α=4.91 was the most suitable bivariate copula.
As a supportive analysis, the Sn test statistic and corresponding p values were calculated for the fitted copulae. The p values for all fitted copulae were less than 0.05 other than the Frank copula, which further supports the choice of the Frank copula as the most suitable bivariate copula to jointly model the dependence structure.
A simulation from the fitted Frank copula is shown in Fig. 6. This plot shows 150 randomly sampled points from the fitted copula and the observations. There was qualitative similarity between the observed and simulated relationship between the log-transformed ATD and maximum landfalling wind speed. Both showed the consistent positive relationship between the two variables. Log-transformed marginal ATD distribution and maximum landfalling wind speed marginal distribution are also shown for the combined simulation and observation data.

Figure 6Observations and simulations from fitted Frank copula (α=4.91) with histograms combined of observations and simulations of maximum landfalling wind speed and log-transformed ATD.
This study aimed to identify a possible approach to simulate hurricane damages (area of total damage) using the maximum landfalling wind speed. It attempted to demonstrate a simple and useful approach, to approximate the complex processes that determine the magnitude of destruction caused by hurricanes. The damage caused by a hurricane is dependent on many interrelated factors including rain, storm surge and tornadoes, but this simple relationship could be used as a proxy to complex physical or statistical modelling.
Initially, this study identified a significant correlation between the ATD and the maximum landfalling wind speed and investigated the sensitivity of this correlation over time and varying wind speed magnitude categories. A bivariate copula approach was explored to determine if it was a viable approach to generate a synthetic data set of hurricane damages and which copula family was most appropriate. A total of six copula families were fit to the data, and contour plots of the fitted copulae and of the kernel density estimate of the observed data were plotted. Since the observed data had a relatively symmetric density, the tail dependence structure of the Gumbel, Clayton and Joe copulae were not reflective of the underlying data. A Frank bivariate copula was determined the most suitable copula by visual inspection of the contour plots to model the relationship between the ATD and the maximum landfalling wind speed. Due to significant skewness and heavy tailedness in the observed ATD marginal distribution, the ATD was log-transformed. In addition to modelling the joint distribution of ATD and the maximum landfalling wind speed, a descriptive analysis and spatial assessment of the data was conducted. This analysis highlighted the significant variability of annual ATD and mean maximum landfalling wind speed over the study period. In addition, it found that there were no statistically significant differences in the landfalling wind speed with respect to latitude.
Understanding the potential damage that hurricanes could cause is vitally important for local, state and federal authorities as well as insurance and reinsurance companies. The historical record of hurricanes is limited due to unreliable and incomplete records; however, a period of approximately 100 years is thought to be relatively complete and reliable (Neumann et al., 1999). The number of these hurricanes that make landfall in the United States is a fraction of these data; this limits the data set even further. Due to the paucity of data, estimating the risk of hurricanes is associated with large uncertainty and alternative methods such as stochastic models have been used (Russell, 1971). A copula-based approach as suggested in this study may offer an alternative by enhancing the historical data with a synthetic simulated data set.
To our knowledge, this is the first study to investigate the relationship between hurricane damage and maximum landfalling wind speed through a bivariate copula method. We believe that the results from this study indicate that it is a potential avenue for future research to investigate the damage–wind strength relationship of hurricanes. For example, estimating the return periods of potential hurricane destruction is an integral part of hurricane risk assessment. One application of this work could be to use the fitted Weibull marginal distributions and Frank copula to estimate several high quantiles of the ATD conditional on the maximum wind speed exceeding a specific return level, e.g. 5- or 10-year return level (Heffernan and Tawn, 2004).
Future work will explore the use of higher-dimensional copulae to account for additional predictors of hurricane damage. Additionally, more flexible copulae could be used to improve goodness of fit for higher-dimensional data, including asymmetric copulae (Liebscher, 2008). High-dimensional copula modelling can be challenging despite the introduction of methods such as hierarchical Archimedean copulae and vine copulae. Quantile regression could be used as an alternative approach with higher-dimensional data.
The data used in this study are freely available in the supplementary materials of Grinsted et al. (2019).
The author declares that there is no conflict of interest.
The author thanks the associate editor and the two referees, who undoubtedly improved the quality of the manuscript.
This paper was edited by Mark Risser and reviewed by Whitney Huang and one anonymous referee.
AghaKouchak, A., Easterling, D., Hsu, K., Schubert, S., and Sorooshian, S.: Extremes in a Changing Climate: Detection, Analysis and Uncertainty, Springer Science & Business Media, 2012.
Akaike, H.: A new look at the statistical model identification, IEEE Trans. Automat. Contr., 19, 716–723, https://doi.org/10.1109/TAC.1974.1100705, 1974.
Bakkensen, L. A., Park, D.-S. R., and Sarkar, R. S. R.: Climate costs of tropical cyclone losses also depend on rain, Environ. Res. Lett., 13, 074034, https://doi.org/10.1088/1748-9326/aad056, 2018.
Barthel, F. and Neumayer, E.: A trend analysis of normalized insured damage from natural disasters, Climatic Change, 113, 215–237, https://doi.org/10.1007/s10584-011-0331-2, 2012.
Bouwer, L. M. and Wouter Botzen, W. J.: How sensitive are US hurricane damages to climate? Comment on a paper by WD Nordhaus, Clim. Change Econ., 2, 1–7, 2011.
Delignette-Muller, M. L. and Dutang, C.: fitdistrplus: An R package for fitting distributions, J. Stat. Softw., 64, 1–34, https://doi.org/10.1142/S2010007811000188, 2015.
Emanuel, K., Sundararajan, R., and Williams, J.: Hurricanes and global warming: Results from downscaling IPCC AR4 simulations, Bull. Am. Meteorol. Soc., 89, 347–368, https://doi.org/10.1175/BAMS-89-3-347, 2008.
Estrada, F., Botzen, W. W., and Tol, R. S.: Economic losses from US hurricanes consistent with an influence from climate change, Nat. Geosci., 8, 880–884, 2015.
Fang, Y. and Jawitz, J. W.: High-resolution reconstruction of the United States human population distribution, 1790 to 2010, Sci. Data, 5, 180067, https://doi.org/10.1038/sdata.2018.67, 2018.
Genest, C., R'emillard, B., and Beaudoin, D.: Goodness-of-fit tests for copulas: A review and a power study, Insur. Math. Econ., 44, 199–213, https://doi.org/10.1016/j.insmatheco.2007.10.005, 2009.
Grinsted, A., Ditlevsen, P., and Christensen, J. H.: Normalized US hurricane damage estimates using area of total destruction, 1900–2018, P. Natl. Acad. Sci. USA, 116, 23942–23946, https://doi.org/10.1073/pnas.1912277116, 2019.
Hamid, S., Golam Kibria, B. M., Gulati, S., Powell, M., Annane, B., Cocke, S., Pinelli, J.-P., Gurley, K., and Chen, S.-C.: Predicting losses of residential structures in the state of Florida by the public hurricane loss evaluation model, Stat. Methodol., 7, 552–573, https://doi.org/10.1016/j.stamet.2010.02.004, 2010.
Heffernan, J. E. and Tawn, J. A.: A conditional approach for multivariate extreme values (with discussion), J. R. Stat. Soc. Ser. B Stat. Methodol., 66, 497–546, https://doi.org/10.1111/j.1467-9868.2004.02050.x, 2004.
Hofert, M., Kojadinovic, I., Maechler, M., and Yan, J.: copula: Multivariate Dependence with Copulas, available at: https://CRAN.R-project.org/package=copula, R package version 0.999-20, last access: 17 May 2020.
Hsiang, S. M. and Narita, D.: Adaptation to cyclone risk: Evidence from the global cross-section, Clim. Change Econ., 3, 1250011, https://doi.org/10.1142/S201000781250011X, 2012.
Joe, H.: Multivariate Models and Multivariate Dependence Concepts, 1st Edn., Chapman and Hall/CRC, CRC Press, London, UK Monographs on statistics and applied probability, 73, https://doi.org/10.1201/9780367803896, 1997.
Kendall, M. G.: A new measure of rank correlation, Biometrika, 30, 81–93, https://doi.org/10.2307/2332226, 1938.
Knapp, K. R.: International Best Track Archive for Climate Stewardship: Report and Recommendations, WMO, Honolulu, Hawaii, USA, 10 pp., 2016.
Knapp, K. R., Kruk, M. C., Levinson, D. H., Diamond, H. J., and Neumann, C. J.: The International Best Track Archive for Climate Stewardship (IBTrACS), B. Am. Meteorol. Soc., 91, 363–376, https://doi.org/10.1175/2009BAMS2755.1, 2010.
Knutson, T. R., McBride, J. L., Chan, J., Emanuel, K., Holland, G., Landsea, C., Held, I., Kossin, J. P., Srivastava, A. K., and Sugi, M.: Tropical cyclones and climate change, Nat. Geosci., 3, 157–163, https://doi.org/10.1038/ngeo779, 2010.
Leahy, T. P.: Spatio-Temporal Models of West Pacific Tropical Cyclones, PhD, Imperial College London, London, UK, 18–19, https://doi.org/10.25560/78692, 2019.
Liebscher, E.: Construction of asymmetric multivariate copulas, J. Multivariate. Anal., 99, 2234–2250, https://doi.org/10.1016/j.jmva.2008.02.025, 2008.
Mejia, M. S. A.: Gone with the Wind: Estimating Hurricane and Climate Change Costs in the Caribbean, International Monetary Fund, Series, 40 pp., 2016.
Mendelsohn, R., Emanuel, K., Chonabayashi, S., and Bakkensen, L.: The impact of climate change on global tropical cyclone damage, Nat. Clim. Change, 2, 205–209, https://doi.org/10.1038/nclimate1357, 2012.
Msadek, R., Vecchi, G. A., and Knutson, T. R.: North Atlantic Hurricane Activity: Past, Present and Future, in: Climate Change: Multidecadal and Beyond, World Scientific, vol. 6, 285–301, https://doi.org/10.1142/9789814579933_0018, 2013.
Murakami, H. and Sugi, M.: Effect of Model Resolution on Tropical Cyclone Climate Projections, Sola, 6, 73–76, https://doi.org/10.2151/sola.2010-019, 2010.
Murakami, H., Wang, Y., Yoshimura, H., Mizuta, R., Sugi, M., Shindo, E., Adachi, Y., Yukimoto, S., Hosaka, M., and Kusunoki, S.: Future changes in tropical cyclone activity projected by the new high-resolution MRI-AGCM, J. Climate, 25, 3237–3260, https://doi.org/10.1175/JCLI-D-11-00415.1, 2012.
Nelsen, R. B.: An introduction to copulas, Springer Series in Statistics, Springer-Verlag New York, 2006.
Neumann, C. J., Jarvinen, B. R., McAdie, C. J., and Hammer, G. R..: Tropical Cyclones of the North Atlantic Ocean, 1871–1998, NOAA, Ashville, NC, 1999.
Nordhaus, W. D.: The economics of hurricanes and implications of global warming, Clim. Change Econ., 1, 1–20, https://doi.org/10.1142/S2010007810000054, 2010.
Pielke Jr., R. A. and Landsea, C. W.: Normalized hurricane damages in the United States: 1925–95, Weather Forecast., 13, 621–631, https://doi.org/10.1175/1520-0434(1998)013<0621:NHDITU>2.0.CO;2, 1998.
Pielke Jr., R. A., Gratz, J., Landsea, C. W., Collins, D., Saunders, M. A., and Musulin, R.: Normalized hurricane damage in the United States: 1900–2005, Nat. Hazards Rev., 9, 29–42, https://doi.org/10.1061/(ASCE)1527-6988(2008)9:1(29), 2008.
Roach, J.: AccuWeather's 2019 total hurricane damage estimate is $22 billion, available at: https://www.accuweather.com/en/weather-news/accuweathers-2019-total-storm-damage-estimate-is-22-billion/604569, last access: 14 March 2020.
Russell, L. R.: Probability Distributions for Hurricane Effects, J. Waterway Div.-ASCE, 97, 139–154, 1971.
Schmidt, S., Kemfert, C., and Höppe, P.: Tropical cyclone losses in the USA and the impact of climate change–A trend analysis based on data from a new approach to adjusting storm losses, Environ. Impact Assess., 29, 359–369, 2009.
Schmidt, S., Kemfert, C., and Höppe, P.: The impact of socio-economics and climate change on tropical cyclone losses in the USA, Reg. Environ. Change, 10, 13–26, https://doi.org/10.1016/j.eiar.2009.03.003, 2010.
Schwarz, G.: Estimating the dimension of a model, Ann. Stat., 6, 461–464, 1978.
Sklar, A.: Random variables, joint distribution functions, and copulas, Kybernetika, 9, 449–460, 1973.
Sklar, M.: Fonctions de repartition an dimensions et leurs marges, Publ. Inst. Stat. Univ. Paris, 8, 229–231, 1959.
Strobl, E.: The economic growth impact of natural disasters in developing countries: Evidence from hurricane strikes in the Central American and Caribbean regions, J. Dev. Econ., 97, 130–141, https://doi.org/10.1016/j.jdeveco.2010.12.002, 2012.
The Weather Channel: Hurricane Dorian Becomes the 5th Atlantic Category 5 in 4 Years, Weather Channel, available at: https://weather.com/storms/hurricane/news/2019-09-01-hurricane-dorian-atlantic-hurricane-category-five-history, last access: 14 March 2020.
Weinkle, J., Landsea, C., Collins, D., Musulin, R., Crompton, R. P., Klotzbach, P. J., and Pielke, R.: Normalized hurricane damage in the continental United States 1900–2017, Nat. Sustain., 1, 808–813, https://doi.org/10.1038/s41893-018-0165-2, 2018.
Zegarra, M. A., Schmid, J. P., Palomino, L., and Seminario, B.: Impact of Hurricane Dorian in The Bahamas: A View from the Sky, Inter-American Development Bank, Washington DC, 2020.
Zhai, A. R. and Jiang, J. H.: Dependence of US hurricane economic loss on maximum wind speed and storm size, Environ. Res. Lett., 9, 064019, https://doi.org/10.1088/1748-9326/9/6/064019, 2014.
Zhang, L., Karnauskas, K. B., Donnelly, J. P., and Emanuel, K.: Response of the North Pacific tropical cyclone climatology to global warming: Application of dynamical downscaling to CMIP5 models, J. Climate, 30, 1233–1243, https://doi.org/10.1175/JCLI-D-16-0496.1, 2017.