the Creative Commons Attribution 4.0 License.
the Creative Commons Attribution 4.0 License.
 | 15 Mar 2022
Spatial heterogeneity in rain-bearing winds, seasonality and rainfall variability in southern Africa's winter rainfall zone
Willem Stefaan Conradie
Piotr Wolski
Bruce Charles Hewitson
A renewed focus on southern Africa's winter rainfall zone (WRZ) following the Day Zero drought and water crisis has not shed much light on the spatial patterns of its rainfall variability and climatological seasonality. However, such understanding remains essential in studying past and potential future climate changes. Using a dense station network covering the region encompassing the WRZ, we study spatial heterogeneity in rainfall seasonality and temporal variability. These spatial patterns are compared to those of rainfall occurring under each ERA5 synoptic-scale wind direction sector. A well-defined “true” WRZ is identified with strong spatial coherence between temporal variability and seasonality not previously reported. The true WRZ is composed of a core and periphery beyond which lies a transition zone to the surrounding year-round rainfall zone (YRZ) and late summer rainfall zone. In places, this transition is highly complex, including where the YRZ extends much further westward along the southern mountains than has previously been reported. The core receives around 80 % of its rainfall with westerly or north-westerly flow compared to only 30 % in the south-western YRZ incursion, where below-average rainfall occurs on days with (usually pre-frontal) north-westerly winds. This spatial pattern corresponds closely to those of rainfall seasonality and temporal variability. Rainfall time series of the core and surroundings are very weakly correlated (R2<0.1), also in the winter half-year, implying that the YRZ is not simply the superposition of summer and winter rainfall zones. In addition to rain-bearing winds, latitude and annual rain day climatology appear to influence the spatial structure of rainfall variability but have little effect on seasonality. Mean annual rainfall in the true WRZ exhibits little association with the identified patterns of seasonality and rainfall variability despite the driest core WRZ stations being an order of magnitude drier than the wettest stations. This is consistent with the general pattern of near homogeneity within the true WRZ, in contrast to steep and complex spatial change outside it.
- Article
(16150 KB) - Full-text XML
- Companion paper
- BibTeX
- EndNote


Southern Africa's winter rainfall zone (WRZ) is a climatically and ecologically hyper-diverse and complex region in which Cape Town is situated (Procheş et al., 2005; Bradshaw and Cowling, 2014; Wolski et al., 2021). Despite the WRZ's relatively low interannual rainfall variability for its subtropical location (Cowling et al., 1999, 2005; Deitch et al., 2017), severe multi-year droughts have occurred three times in the historical record, linked to high-amplitude, quasi-periodic low-frequency variability (Hoffman et al., 2009; Pascale et al., 2020; Wolski et al., 2021). Cape Town's more than 4.5 million inhabitants and most of the approximately 2 million additional inhabitants of the WRZ (Statistics South Africa, 2020) are dependent almost exclusively on a few surface water reservoirs in the surrounding Cape Fold Belt mountains for their water supply (Sinclair-Smith and Winter, 2019; Wolski et al., 2021). High-value fruit farming that is crucial to the regional economy and supporting rural livelihoods is almost entirely dependent on this resource, while rain-fed wheat farming is also widely practised (Kloppers, 2014; Archer et al., 2019; Theron et al., 2021). The WRZ and adjacent year-round rainfall zone (YRZ) together correspond approximately to the Greater Cape Floristic Region global biodiversity hotspot (Bayer, 1984; Born et al., 2007; Myers et al., 2000), which has been the focus of extensive ecological and palaeoclimatic research that has contributed substantial climatic insights (e.g. Quick et al., 2016; Engelbrecht et al., 2019; Slingsby et al., 2021, and references therein). The eco-region's spatial evolution over long timescales is seen as key to understanding changes in the Southern Hemisphere (SH) westerlies (Chase and Meadows, 2007; Stager et al., 2012). However, both ecological diversity and palaeoecological change patterns differ between the WRZ and the YRZ, with considerable uncertainty remaining about patterns of past climate change, particularly in the transitional zones (Chase et al., 2019; Engelbrecht et al., 2019). Disagreements regarding rainfall seasonality and variability in the transitional regions from the WRZ into its surroundings (Roffe et al., 2019) may be a contributing factor.
There is broad consensus that the WRZ is largely confined to a narrow band along the South African west coast, but in some undersampled transition regions considerable differences in classification occur by data source and classification method. Roffe et al. (2019) review a range of approaches to defining South African rainfall seasonality, finding particular disagreement regarding the boundaries between the WRZ, YRZ and summer rainfall zone (SRZ) along the south-western sections of southern Africa's Great Escarpment (henceforth referred to as “the south-western escarpment”; see Sect. 2 and Fig. 1). Following Chase and Meadows (2007), in recent palaeoclimatic and ecological studies, the WRZ conventionally has been defined as the region where more than 66 % of mean annual rainfall (MAR) occurs during the winter half-year (April–September or AMJJAS; henceforth, we follow the conventional practise of denoting all seasons by the capitalised, ordered sequence of the first letter of the months in the season). Locations receiving 33 % to 66 % of MAR during AMJJAS are then classified as YRZ and those receiving less than 33 % as SRZ (e.g. Chase et al., 2019; Granger et al., 2018; Procheş et al., 2005), usually using WorldClim data (Hijmans et al., 2005; Fick and Hijmans, 2017). In some ecological studies, MJJASO – the 6 coolest months in the WRZ and YRZ – has been used as an alternative winter half-year definition (e.g. Aschmann, 1973; Bradshaw and Cowling, 2014). A continuous measure such as mean seasonal rainfall contributions helps identify spatially gradual and abrupt seasonality transitions (Bradshaw and Cowling, 2014). However, a shortcoming of these approaches is that they are unable to capture differences in monthly rainfall climatology, which are important when considering locations with a distinct late summer or bimodal rainfall peak (cf. Roffe et al., 2021b).

Figure 1Topographic map of the region containing the WRZ. Place names referred to in the text are labelled. See Table A1 for meanings of abbreviations used. Blue labels refer to reservoirs or other river features, red labels to point locations and black labels to regions. Purple lines represent the Great Escarpment (in different shades by section) and orange lines the Cape Fold Belt (CFB) (in different shades for the meridional and zonal branches). Map tiles are by Stamen Design (http://stamen.com/, last access: 3 March 2022) under CC BY 3.0 (http://creativecommons.org/licenses/by/3.0, last access: 3 March 2022) and underlying data (OpenStreetMap, http://openstreetmap.org/, last access: 3 March 2022) under ODbL (http://www.openstreetmap.org/copyright, last access: 3 March 2022).
The WRZ is usually studied as a single unit characterised by a smooth west–east gradient in winter contribution to MAR (Bradshaw and Cowling, 2014). Climatic studies have tended to focus on the southern WRZ, studied as a uniform whole (e.g. Reason and Rouault, 2005; Blamey et al., 2017). The southern WRZ falls within South Africa's Western Cape Province. It is often studied as a seasonality domain distinct from the province's YRZ and SRZ (e.g. Van Niekerk and Joubert, 2011; Du Plessis and Schloms, 2017; Abba Omar and Abiodun, 2020). Other studies considered the province to be a uniform winter-rainfall climate unit (e.g. Masante et al., 2018; Lakhraj-Govender et al., 2019; Naik and Abiodun, 2019; Kam et al., 2021). This is, however, inaccurate, as less than half the provincial area experiences a distinct winter precipitation peak (see Results). Furthermore, the northern WRZ falls mostly outside the province. Northern WRZ climatology has been studied mostly in relation to ecological diversity (Cowling et al., 1999; Desmet, 2007; MacKellar et al., 2007). The relationship between southern WRZ and northern WRZ variability, seasonality and weather systems has not been rigorously assessed.
The WRZ and its surroundings form a spatially complex region with large gradients in MAR, seasonality, temporal rainfall variability and various other climatic variables (Lynch, 2004; Bradshaw and Cowling, 2014; Mbokodo et al., 2020). This heterogeneity has previously been considered in studies by e.g. Favre et al. (2013), Philippon et al. (2012), Mahlalela et al. (2019) and Abba Omar and Abiodun (2021). However, it is not well understood from the perspective of large-scale drivers and local responses. It has also not been subject to focused analysis with a dense station network. Hence, the spatial pattern of seasonality and variability remains poorly understood. The spatial pattern of transition out of the WRZ to its surroundings, in particular, has not been systematically studied. Locations near the northern and north-eastern boundaries of the WRZ have been documented to display highly variable seasonality over time (Desmet and Cowling, 1999; Nicholson, 2000; Roffe et al., 2021b), but the phenomenon is poorly understood. Mahlalela et al. (2019) and Philippon et al. (2012) explored subregional structure in the southern WRZ using cluster analysis of stations by rainfall annual cycle. However, this variable is dominated by amplitude differences between dry and wet regions. Differences in seasonality within the region have not been considered explicitly. Focusing on standardised variability, Wolski et al. (2021) detect three spatially continuous subregions of the WRZ, displaying a high degree of internal coherence that remains underexplored, since most of the northern WRZ was not considered and relatively few stations were used. Of the Day Zero drought studies, only Abba Omar and Abiodun (2020) have shown a link between spatial rainfall variability patterns and variability in rainfall drivers (cut-off lows – COLs). It has been proposed that spatial differences in recent rainfall variability and trends may be related to wind directions from which rainfall is primarily received (Deacon et al., 1992; Wolski et al., 2021), but this hypothesis has not been systematically tested.
To understand drivers of rainfall variability and trend, the spatial units sharing variability characteristics need to be investigated. Given that specific wind directions are closely associated with the stages of passage of the primary synoptic rain-bearing system (viz. cold fronts; Burls et al., 2019), studying the spatial wind direction–rainfall relationship in the WRZ should contribute to such understanding. This, in turn, would allow for more robust, locally relevant, climate change signal projections in this water-sensitive region. Hence, to complement the trend focus of Wolski et al. (2021), here we look at variability and seasonality and relate them to spatial and seasonal heterogeneity in rain-bearing winds. Section 2 provides a brief overview of the study domain, Sect. 3 describes the methods and data employed, Sect. 4 presents the primary findings of the study, Sect. 5 introduces a new spatial subdivision of the region, Sect. 6 considers the results and framework in the context of recent studies of the WRZ and Sect. 7 summarises the findings and their implications and limitations.
The WRZ stretches roughly from Cape Agulhas – the southernmost tip of Africa – along the west coast beyond the Gariep River mouth into far south-western Namibia (see Fig. 1). The south-western mountains are very wet (MAR>1500 mm), but the WRZ also encompasses hyper-arid areas (MAR<100 mm) in northern coastal Namaqualand and the Tanqua Karoo (Lynch, 2004; Schulze and Maharaj, 2007; Slingsby et al., 2021).
The WRZ's complex topography – it has the second-highest median topographic heterogeneity among Mediterranean-type climate regions (Bradshaw and Cowling, 2014) – is responsible for much of the steep MAR gradients in the region. Topographically, the southern and western coastal belts – encompassing most of the WRZ – are dominated by the Cape Fold Belt. The Cape Fold Belt is composed of two series of mountain chains, one running zonally, roughly parallel to the south coast and warm Agulhas Current, and the other meridionally, parallel to the cold Benguela Current. In addition to high topographic heterogeneity, the unique proximity to both an eastern and a western boundary current (Veitch and Penven, 2017; Mahlalela et al., 2019) and alignment of these currents with the orientation of the Cape Fold Belt chains contribute to large gradients in MAR, rainfall seasonality and rain-bearing winds and systems (Cowling and Lombard, 2002; Procheş et al., 2005; Bradshaw and Cowling, 2014). In the north-east, beyond the Cape Fold Belt, the southern, south-western and western sections of the escarpment form a prominent barrier to southerly and westerly flow into the vast interior plateau beyond. The Cape Peninsula, jutting out from the south-western coast to Cape Point, is immediately apparent and is usually the location of landfall for cold fronts affecting the WRZ (Conradie et al., 2022c). On closer inspection, this peninsula is best conceptualised as a small but prominent protrusion from a larger, “blunt” peninsula, stretching from Verlorenvlei to the Breede River mouth (Compton, 2004).
The meridional and zonal chains of the Cape Fold Belt meet in an intricate set of mountain ranges – the Boland Mountain Cluster – where the wettest observing stations in extratropical southern Africa (MAR>3000 mm) are located (Slingsby et al., 2021; de Buys, 2019; South African Forestry Research Institute (SAFRI) and Council for Scientific and Industrial Research (CSIR), 2020a, b). The Boland Mountain Cluster is also where the highest rates of biodiversity and endemism in the Cape Floristic Region are observed (Rebelo et al., 2006; Cowling et al., 2017) and where the highest proportion of MAR falls during winter (see Results). The wet Boland Mountain Cluster is the source of almost all water for the Western Cape Water Supply System (WCWSS) of interconnected reservoirs (Sinclair-Smith and Winter, 2019) upon which Cape Town depends as well as of most of the other major reservoirs of the WRZ. However, there are very few high-altitude stations with reasonable-quality multi-decadal daily data in the Boland Mountain Cluster. Although the WRZ is frequently described as having a Mediterranean-type climate (e.g. Barrable et al., 2002; Van Niekerk and Joubert, 2011; Polade et al., 2017), in a single 0.5∘ latitude–longitude grid cell in the Boland Mountain Cluster are stations recording MAR too low and others too high to qualify for such a classification (Lynch, 2004; Schulze and Maharaj, 2007) using any of the definitions employed by Aschmann (1973), Engelbrecht and Landman (2016) and Deitch et al. (2017). Consequently, we use the term Mediterranean-like – instead of Mediterranean-type – climate regions to refer collectively to all subtropical and temperate regions with dominant winter rainfall seasonality.
3.1 Rainfall data
Two station datasets are employed: one covering southern Africa, the other the WRZ domain only. A list of stations included in the WRZ dataset together with associated metadata is provided in Table . A gridded dataset (Global Precipitation Climatology Centre – GPCC) is used to supplement station-based results.
3.1.1 Southern Africa dataset
To delineate the WRZ and characterise it in the southern African context, we use the southern African station dataset of Dent et al. (1987) and Lynch (2004) updated with South African Weather Service (SAWS) data to 2015. These daily rainfall data are subject to the quality control procedures described in Wolski et al. (2021). We use this dataset primarily to gain qualitative insights into rainfall seasonality from a dense station network covering a large area; consequently, only a limited effort is made to eliminate biases due to differences in the periods of record between stations. We require non-missing values for the equivalent of at least 25 complete years (25×365.25 d) unless otherwise indicated. Where time series of annual totals are regressed against time series of seasonal totals, at least 25 calendar years of data with at least 90 % coverage in each season are required. In all cases, means and variances are computed across the full available record and missing values are not infilled.
3.1.2 WRZ dataset
From the stations in the southern African dataset still reporting to SAWS in 2017, stations were selected with at least 95 % daily data coverage for the period 1979–2015 that fall within South-Western Southern Africa (defined here as Africa west of 22∘ E and south of 26∘ S; depicted in Fig. A1). Stations are retained only if %AMJJAS≥50 – where %AMJJAS denotes the climatological percentage of MAR falling during AMJJAS. Additional stations were selected with at least 90 % data availability in undersampled regions. Preference was given to automatic weather stations as these were found to report rain days more consistently with nearby stations (see point 6 in Sect. A2). For these stations, updated data were received from SAWS to the end of September 2018 in most cases (see Table ). Further station data were obtained from the South African Department of Water Affairs and Sanitation (DWS; see Wolski et al., 2021) for stations in South-Western Southern Africa. See Sect. A1.1 for an overview of DWS station selection. The City of Cape Town (CoCT) also provided daily data from January 2000 to the end of 2018 for selected stations. Only CoCT stations for which a record was also available from SAWS and/or DWS were included in the main dataset (it is relatively common for there to be overlap in the periods of record held by different institutions for the same station; see Lynch, 2004) due to their short periods of record. Selected stations with short periods of record but reliable coverage therein were included as a nearest-neighbour dataset to support infilling and time shifting (see Sect. A1.2 for details).
3.1.3 GPCC data
The GPCC version 2018 precipitation climatology (preferentially for 1950–2000; Schneider et al., 2017; Meyer-Christoffer et al., 2018) and full data monthly (Becker et al., 2013; Schneider et al., 2018) datasets, both at 0.25∘ spatial resolution, are used to assess rainfall seasonality in a spatially continuous gauge-based dataset. GPCC is chosen due to its extensive temporal coverage and demonstrated veracity over the WRZ (Wolski et al., 2021).
3.2 Outline of cleaning methodology
Since our intention with the WRZ dataset is to conduct detailed daily, monthly, seasonal and annual analyses, having an unbiased, continuous series is necessary. For this purpose, a new cleaning methodology is developed and applied to the WRZ dataset (described in Sect. 3.1.2). A paper is in preparation describing the methodology in greater detail and demonstrating its effectiveness, but an overview of each component is provided in Sect. A2. The iterative procedure includes fitting the Generalised Additive Model for Location, Shape and Scale (GAMLSS; Rigby and Stasinopoulos, 2005) to station series (see Sect. A2, point 10). The procedure is intended to correct as far as possible for common quality shortcomings in South African rainfall data. These are identified by comparing different data sources for the same station, where station records are held by multiple institutions. These data irregularities include spurious sequences of zeroes and repeated equal non-zero values, rainfall recorded a day early or late, decimal errors, miscellaneous differences in values recorded for the same station on the same day and recording cumulative totals as daily rainfall (cf. Roffe et al., 2021a). An initial infilling is done by correlation coefficient weighting (CCW; see Smithers and Schulze, 2000) on rank correlation and then updated with estimates from the model fit. Where infilling is done with a GAMLSS fit, rain days are selected stochastically, with probability of rain on each day determined by the model fit.
3.3 Wind direction
The relationship between synoptic-scale wind direction and rainfall is assessed using a substantial adaptation to the WRZ of the circulation weather type (CWT) methodology of Trigo and DaCamara (2000). Following a similar approach to Sousa et al. (2018) – given the small WRZ domain – we distinguish 10 classes based on the large-scale boundary-layer wind direction and refer to these as CWTs. However, in contrast to Sousa et al. (2018), since the WRZ is most frequently subject to relatively uniform synoptic-scale flows with dominant local- rather than regional-scale modulations, we do not include cyclonic and anti-cyclonic CWTs. Instead, in addition to the CWTs corresponding to each of the eight major (cardinal plus intercardinal) wind directions, weak synoptic flow (WF) and incoherent synoptic flow (IF) patterns are classified.
Trigo and DaCamara (2000) use sea-level pressure to deduce surface geostrophic flow. However, given the complex topography of the WRZ and frequent sea breezes and off-shore flows due to high temperature gradients (e.g. van Rooy, 1936), synoptic flow is directly assessed from the European Centre for Medium-Range Weather Forecasts (ECMWF) Interim Re-Analysis 0.75∘ (ERA-Interim; Dee et al., 2011) and ECMWF Re-Analysis-5 0.25∘ (ERA5; Hersbach et al., 2020) 6-hourly 900 hPa reanalysis u (zonal) and v (meridional) wind vector components. The domain considered is N, E (for latitude ϕ and longitude θ). The procedure involves the following steps (in what follows, denotes the spatial mean of x).
-
All time steps when the magnitude of the mean flow vector , suggesting either dominance of local forcing over synoptic flow or competing synoptic forcing in the domain, are classified as IF.
-
Remaining time steps when m s−1 are classified as WF.
-
All remaining time steps are classified according to the direction of Ψ assigned to one of the eight major 45∘-wide wind-direction-bearing sectors (e.g. 22.5 to 67.5∘ is classified as NE).
-
Since South African daily precipitation measurements are taken for the 24 h observation period ending at 06:00 UTC (08:00 SAST) the next morning, each time step other than 06:00 UTC is weighted as contributing 0.25 to the rainfall total for the daily observation period within which it falls. The wind directions for the 06:00 UTC data points are assigned 0.125 contribution weightings to both the observation period ending and the one starting at that time.
-
Total rainfall at each station occurring under each CWT is calculated and normalised by MAR, yielding the proportion of rainfall contributed under that CWT.
3.4 Clustering
Hierarchical Ward clustering (Ward, 1963) is used to group stations in line with previous studies in the WRZ
(e.g. Wolski et al., 2021; Burls et al., 2019). Cluster analysis is performed
on the following three variables.
Climatological normalised seasonality clustering. Monthly mean rainfall at each station is computed over the period of record, expressed as the proportion of MAR falling in that month.
Annual and winter semester interannual variability clustering. Clustering is performed on z scores, using all complete years as variables.
Annual CWT contribution clustering. Clustering is performed on the proportion of MAR occurring under each of the considered CWTs.
3.5 Analysis and plotting
A rain day is defined as occurring when at least 1 mm is recorded (see Conradie et al., 2022b). In Fig. 5b a Daniell smoother is used to provide a more consistent estimate of the true spectral density (von Storch and Zwiers, 1999, Sect. 12.3). Software used is listed in Sect. A3. Qualitative colour schemes employed are derived from Wong (2011), https://personal.sron.nl/~pault/ (Paul Tol's Qualitative Schemes, last access: 3 March 2022) and the IBM Design Library color-blind friendly scheme (https://davidmathlogic.com/colorblind, last access: 3 March 2022).
4.1 Southern African context
We use normalised seasonality clustering and %AMJJAS to investigate seasonality patterns and gradients around the WRZ in the southern African dataset (Fig. 1). It should be borne in mind that some stations in this dataset exhibit systematic patterns of data gaps that affect seasonality assessments adversely. Hence, we focus only on broader patterns and ignore individual stations that contradict these. We identify five rainfall seasonality domains which we consider to be meaningfully distinct and reasonably spatially coherent. The dominant one is the SRZ; the others are (in the order that they are distinguished from the SRZ, with the parent cluster in brackets, where applicable) (2) WRZ, (3) YRZ (SRZ), (4) late SRZ (SRZ), and (5) extended SRZ (late SRZ). The late SRZ is characterised by a pronounced JFM or FMA peak in rainfall. It is commonly distinguished from the SRZ in South African seasonality studies (cf. Hofmeyr, 1984; Schulze and Maharaj, 2007). The extended SRZ is identified in a broad band along the east coast and southern interior, characterised by a much flatter summer rainfall peak than the (late) SRZ. Maxima occur in early autumn and late spring, suggesting a possible combination of SRZ and YRZ influences. We are not aware of any previous studies noting the similarity in seasonality between the southern interior and east coast. However, it is the least stable cluster; its spatial extent is quite sensitive to period-of-record criteria for station selection. As such, it should perhaps not be conceptualised as a single zone with coherent drivers of seasonality but rather as a combination of two distinct zones exhibiting similar seasonality characteristics resulting from two distinct combinations of seasonality drivers. The section on the east coast corresponds largely to region 14 of Schumann and Hofmeyr (1938) and to the long SRZ of Roffe et al. (2020, in whose study no stations in the southern interior were considered). Schumann and Hofmeyr (1938) identify three rainfall seasonality domains in the southern interior, all exhibiting somewhat similar seasonality to our extended SRZ cluster. Together, this suggests that the southern interior may be conceptualised as a broad transition zone between all four other seasonality zones. In contrast to the extended SRZ cluster, the WRZ cluster is remarkably stable: the same stations are selected for it when identifying between 2 and 10 clusters. The WRZ extent exhibits little change, with varying period-of-record criteria for station selection.
The scalar quantity %AMJJAS effectively captures the primary features of South African rainfall seasonality, both in station and GPCC data, supporting the common use of %AMJJAS in ecological and palaeoclimatic studies (see Sect. 1). The first four clusters are clearly apparent in the %AMJJAS map (Fig. 2a): the WRZ as a narrow west coast band with %AMJJAS≫50, the broad interior SRZ by %AMJJAS≪50 and the YRZ by %AMJJAS≈50. Together, the extended and late SRZs are characterised by . They can be distinguished by further considering climatological OND:JFM or SON:MAM rainfall ratios. In general, seasonality features not apparent in %AMJJAS relate to (a) the relative contributions from shoulder seasons (e.g. very high in the YRZ) and/or (b) early vs. late summer contributions (e.g. low in the late SRZ). The classifications are consistent with a generally westward progression of the summer wet season (e.g. Liebmann et al., 2012; Roffe et al., 2021b). In addition to effectively delineating the primary rainfall seasonality zones, %AMJJAS shows a generally smooth decreasing south-west to north-east gradient and a secondary pattern of decreasing winter contributions away from the east coast (Roffe et al., 2021b). Notable deviations occur on the western (relatively high %AMJJAS) and eastern (very low %AMJJAS) slopes of the Lesotho Drakensberg ( E, 30∘ S) and around St Lucia ( E, 28∘ S), where %AMJJAS>40, thus qualifying as YRZ (cf. Roffe et al., 2021b; Hofmeyr, 1984).
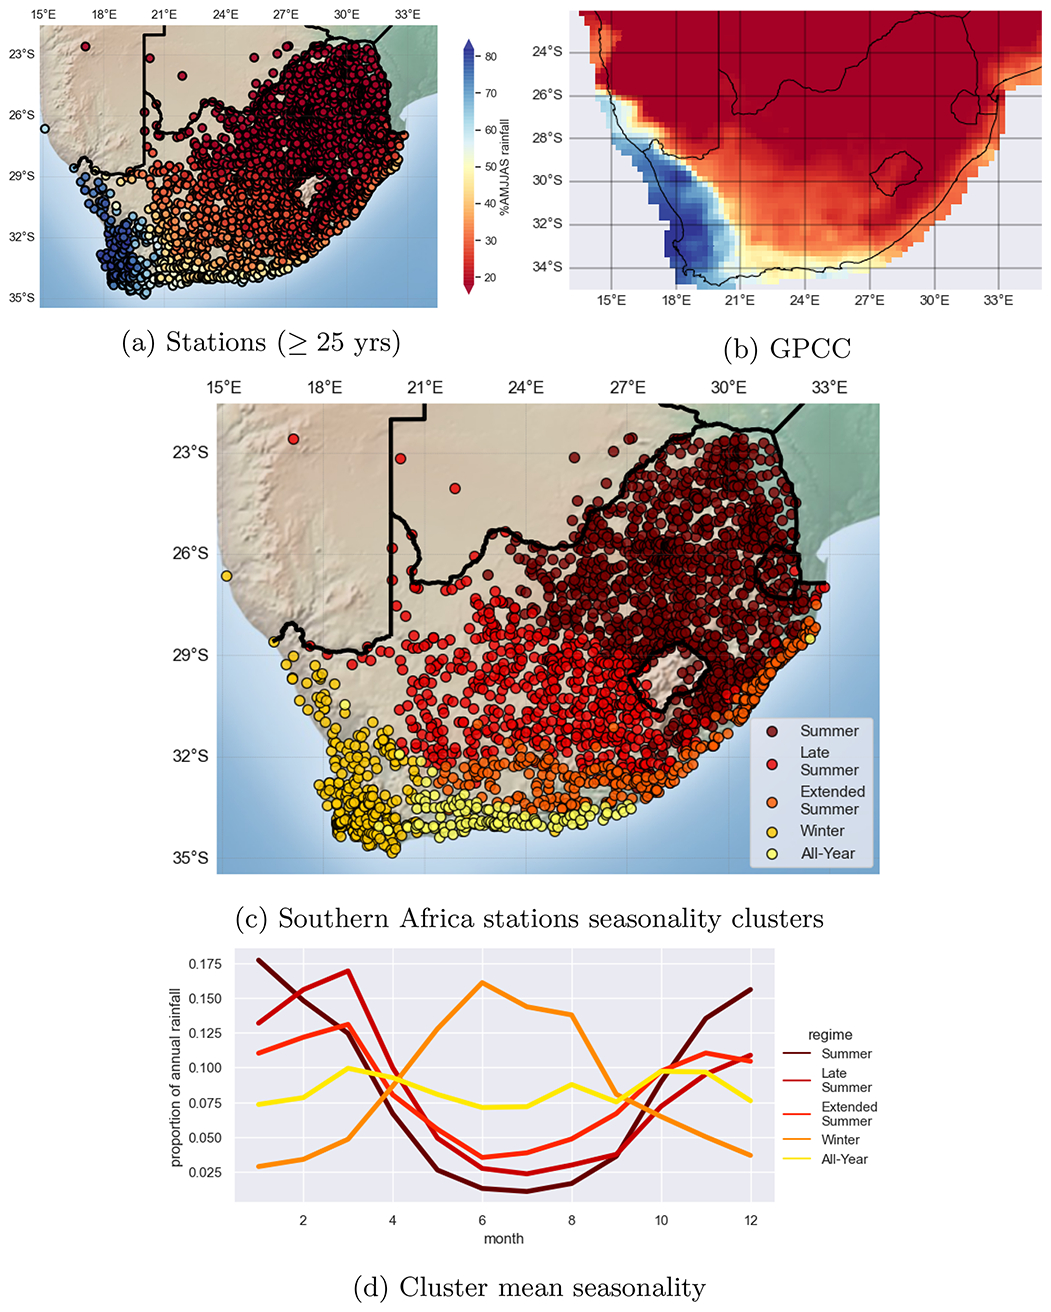
Figure 2The climatological percentage of MAR falling in AMJJAS (a) at southern African stations with the equivalent of at least 25 years of complete data and (b) in GPCC. (c) Climatological normalised seasonality clustering of the same stations as in (a) and (d) the corresponding mean normalised seasonality for each cluster.
4.2 WRZ climatological seasonality
4.2.1 Annual rainfall climatology
It is clear from Fig. 2 that the WRZ is confined to South-Western Southern Africa, as defined in Sect. 3.1.2. We now consider the seasonality of the WRZ station dataset (see Sect. 3.1.2) in detail (Fig. 3). Comparative results from the southern African dataset stations in this domain with at least the equivalent of 20 complete years of daily data (as opposed to 25 years for Sect. 4.1, yielding a much denser station network in undersampled regions) are presented in Fig. A1, allowing for clearer assessment of the patterns of transition out of the WRZ.

Figure 3WRZ dataset: (a) mean annual rainfall; (b, c) as in Fig. 2c and d; (d) %AMJJAS for rainfall; (e) variance in annual time series explained by AMJJAS series; (f) rain days %AMJJAS.
The WRZ dataset includes mostly stations from the WRZ cluster in Fig. 2 but also a few that are classified as YRZ or late SRZ. From the WRZ dataset stations, six distinct seasonality subclusters are identified (Fig. 3b). A spatially coherent but complex transition from the WRZ into the surroundings is apparent. The WRZ of Fig. 2 is subdivided into WRZ, “core” WRZ and southern and northern margin subclusters. The WRZ and WRZ core subclusters together coincide closely with %AMJJAS≳70 (Figs. 3d and A1). They display remarkable zonal uniformity in %AMJJAS, considering the MAR range covered from ≈50 to ≈2000 mm (Figs. 3a and A1a). The core WRZ receives a higher proportion of rainfall during JJ than the other subclusters and is situated mostly along the spine of the meridional Cape Fold Belt.
The margin and transition subclusters exhibit a still distinct but lower-amplitude mid-winter peak in rainfall and . The margin's width and longitudinal position vary substantially with latitude, indicating previously unreported fine-scale complexity in the WRZ edge. Margin_S is a coastal subcluster transitioning to the YRZ and receiving a greater proportion of rainfall during SON. The Margin_N subcluster is on the western escarpment slopes and the Transition along its eastern slopes. Together they represent the transition to the late SRZ, exhibiting a pronounced April rainfall peak together with a lower AS contribution. The Transition subcluster, additionally, features a markedly higher March contribution (see Figs. 2 and A1).
Two regions with dramatic changes in seasonality over a short distance justify particular attention.
-
Along the southern zonal Cape Fold Belt, the YRZ extends west of 19.5∘ E at about 34∘ S (see Figs. 3b and d and A1b and d) – substantially further westward than has previously been reported (Roffe et al., 2019, and references therein) or is suggested by gridded rainfall products, such as GPCC, CRU and WorldClim (see also Sect. 1, and references therein). This narrow band exhibits the characteristic bimodal YRZ rainfall seasonality (see Figs. 3c and A1c) with equinoctial peaks (cf. Schumann and Hofmeyr, 1938; Engelbrecht et al., 2015).
-
Along a zonal transect from the eastern Cedarberg to the north-western plateau, %AMJJAS first falls from >80 to ∼65 in the Tanqua Karoo and then rises to over 70 on the escarpment before falling steeply across the plateau to below 45 in less than 50 km. When more stations in this band of steep seasonality change are included (Fig. A1), stations with are clustered together as a separate very late SRZ. Although often classified as YRZ (e.g. Rebelo et al., 2006), it is characterised – uniquely in southern Africa – by a distinct unimodal MA peak (see also Schumann and Hofmeyr, 1938, and Engelbrecht et al., 2015). Given the steep seasonality gradients, competing WRZ, YRZ and late SRZ seasonality drivers and the low station density, the sensitivity to the seasonality classification approach is unsurprising.
Although seasonality patterns in the margins largely reflect a damped WRZ pattern, the summer season appears to be the dominant driver of interannual variability here – ONDJFM series are generally better correlated with annual time series than AMJJAS series (Fig. 3e). Correlations by standard 3-month seasons (not shown) confirm this. Although %AMJJAS is near uniform across the western WRZ, ONDJFM influence on annual variability increases notably from south-west to north-west. This is important not only for understanding present-day drought risk and climate change responses in the WRZ margins, but may also help explain the dramatic fine-scale spatial differences in climate responses since the Last Glacial Maximum observed near the present WRZ margin in the north-eastern Cape Fold Belt and northern WRZ, which have been posited to relate to summer- vs. winter-dominated signals (MacPherson et al., 2018; Chase et al., 2011, 2015, 2019).
4.2.2 Rain day seasonality
Whereas Burls et al. (2019) detect much larger trends in the rain day frequency than in total rainfall over the southern WRZ, no thorough assessment of the spatial patterns or variability in WRZ rain days has been conducted. The most striking characteristic of rain day seasonality is that it is much weaker than in rainfall (Fig. 3f). In the south-west, %AMJJAS in rainfall is much greater than that in rain days, whereas in the western YRZ, where %AMJJAS≈50, many more rain days occur during AMJJAS than ONDJFM. Furthermore, clustering by rain day seasonality (Fig. A2) reveals much smaller amplitude difference in seasonal cycle than for rainfall. These findings are consistent with winter rainfall in the WRZ margin being more reliable (as defined and discussed in Cowling et al., 2005; Desmet, 2007) and summer rainfall being more variable and thus disproportionately impacting interannual variability. In the far south-western WRZ, rain day frequency peaks later in winter (often during August) than rainfall (almost always in June); May and September receive similar numbers of rain days, but May mean rainfall tends to be about 50 % greater. This implies greater rainfall intensity in early winter and more frequent gentle rains in late winter. In contrast, the northern WRZ exhibits the highest winter rain day concentration (Fig. 3d), and rain day seasonality closely resembles rainfall seasonality, suggesting that weaker late winter and spring fronts rarely result in rainfall here. YRZ shoulder season rainfall peaks appear to result from higher rainfall intensities rather than greater rain day frequencies.
4.3 WRZ recent variability pattern: seasonal and spatial structure
In Fig. 4, for the WRZ dataset, we present eight annual and seven AMJJAS temporal variability clusters (henceforth variability clusters), each with a high degree of spatial coherence and distinct patterns of variability. Having a higher station density over a larger domain allows us to distinguish more clusters than, for example, Wolski et al. (2021), who perform a similar analysis. Comparing the time series of annual and AMJJAS clusters confirms that AMJJAS dominates variability in the west, whereas summer dominates particularly in the SE variability cluster.
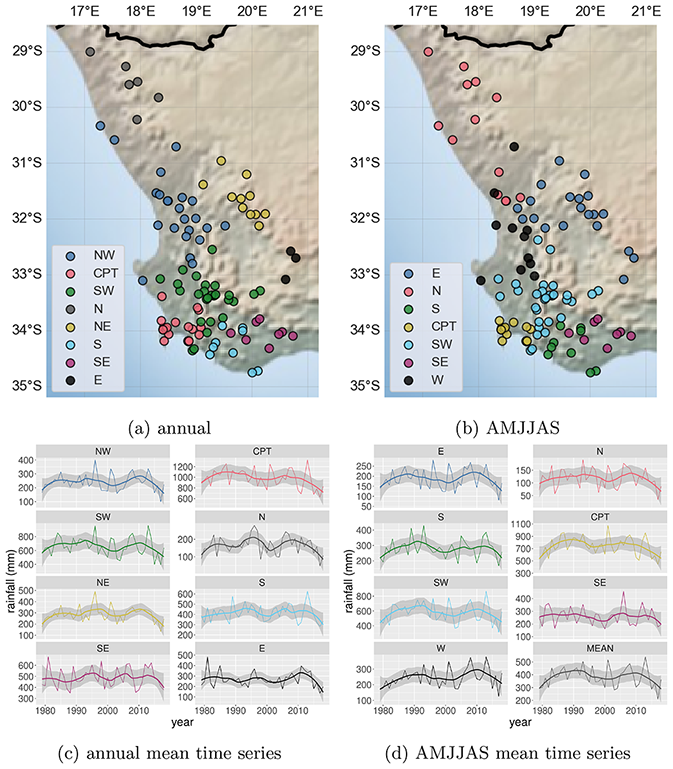
Figure 4(a, c) Annual and (b, d) AMJJAS variability clustering on the WRZ dataset. In (a, b) a map of the cluster distributions is shown and in (b, d) the cluster mean time series with a first-order loess smoother with a 16-year span overlain. Note that, whereas clustering was performed on standardised rainfall anomalies, in order to convey the amplitude and mean climatology of each subregion, the time series shown are of raw spatial mean rainfall.
Comparing Fig. 4a and b to Fig. 3a reveals substantial coherence between the spatial patterns of temporal variability and of seasonality not previously reported. The annual SE and AMJJAS SE variability clusters are identical – and differ from the YRZ seasonality cluster (Fig. 3a) only by including one additional station. The S annual and AMJJAS variability clusters are also identical and correspond largely to the Margin_S seasonality cluster. This suggests common drivers of variability and seasonality. Further support is provided by the cluster mean time series (Fig. 4c and d); between the western variability clusters (CPT, SW, W and NW, collectively largely the same stations as the WRZ and WRZ core seasonality clusters) correlations are strong (all R2>0.5). However, variability patterns in the north-east, south and – most notably – south-east are remarkably different from the western clusters. Some variability is shared between the SE and S cluster series: () and () – and between the SE and E annual cluster series: (p<0.005) – but all other clusters exhibit their lowest pairwise annual and AMJJAS correlations with the SE cluster (R2<0.1; p>0.1 for all western clusters). The fact that correlations are very low not only for annual, but also for AMJJAS series clearly indicates that the differences in variability patterns are not simply the result of summer dominance of SE cluster variability but that the drivers of YRZ winter variability are also distinct from those operating over the WRZ.
In addition to seasonality, temporal variability patterns also exhibit influences of latitude, distance from Cape Point (closely related to annual rain day climatology) and rain day seasonality. Falling in the Winter–Spring rain day seasonality cluster (Fig. A2) appears to distinguish the CPT from the SW annual variability cluster. The CPT stations saw more intense winter drought than the SW stations in 2010 and 2011 and less intense drought during 2017, when weak late-season fronts appear to have reduced drought intensity in the far south-west (see Conradie et al., 2022b). The N AMJJAS and annual variability clusters are distinguished by their northerly latitude, fewer frontal impacts and consequently higher dependence on COL rainfall (cf. Favre et al., 2013). The low number of AMJJAS rain days along the south-western escarpment suggests that only the strongest fronts penetrate this far inland. These systems presumably drive winter variability in the NE annual variability cluster.
To assess the characteristic variability patterns by cluster, we conduct Fourier decomposition of the station time series and cluster mean series. For selected frequencies judged to capture variability characteristic of each of the annual variability clusters, we plot the relative phase and normalised amplitude for all stations by annual variability cluster in Fig. 5a. Almost all WRZ stations exhibit high-amplitude variability at a period of about 6 years with a remarkably similar phase. The largest amplitude is found in stations in the western annual variability clusters. The S, E and – especially – SE variability clusters exhibit large variability with periods near 4 years with a similar characteristic phase. High-frequency variability (<5-year period) is often almost anti-phase between the SW and SE clusters. The S cluster stations show variability patterns generally intermediate between the SW and SE clusters but also have the highest-amplitude quasi-decadal variability. Northern stations tend to have a spectral peak at around 13 years not apparent in the AMJJAS series (not shown), suggesting a summer driver.
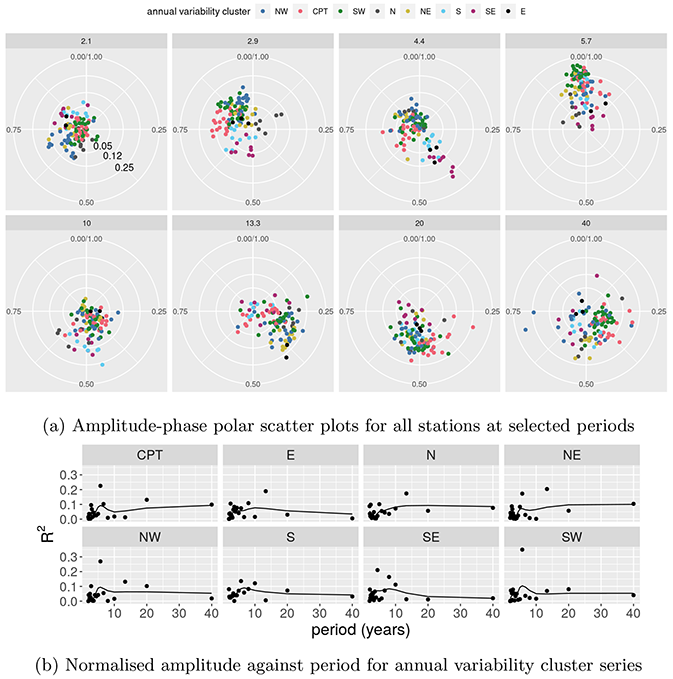
Figure 5Fourier decomposition plots of annual rainfall series. (a) In each panel, the radial co-ordinate represents normalised amplitude (or equivalently the variance explained by that frequency, hence denoted by R2) and the angular co-ordinate the normalised phase shift (equivalently, time to the first peak at the given frequency, as a fraction of the corresponding period). Each panel is for a selected frequency (the corresponding period in years is indicated as the panel heading). The scale is indicated in the lower-right quadrant of the top-left panel. Colours indicate the annual variability cluster (see Fig. 4a and c). (b) Normalised amplitude plotted as points, together with a modified Daniell smoothing (of widths 3 and 5) shown as a line.
In all clusters the AMJJAS series are characterised by two 20-year quasi-cycles (Fig. 4d). The largest amplitude is seen in the CPT variability cluster (not shown), for which the annual time series also shows a marked spectral peak at this frequency (see Fig. 5b). A number of stations in the SW, CPT, N and NE clusters also show pronounced variability at the 40-year timescale, modulating the 20-year cycles. Phases of the 40-year components are generally consistent with low-frequency quasi-periodic variability found in WRZ long-term datasets: substantial satellite-era drying occurs in the southern WRZ, the onset of which is more recent in the northern WRZ (cf. Wolski et al., 2021; Burls et al., 2019; Ndebele et al., 2019). Interannual variability during the second 20-year cycle (1999–2018) is notably greater than during the first 20-year cycle (1979–1998) in the western clusters (Fig. 4c and d). Applying an F test for equality of variance (von Storch and Zwiers, 1999, Sect. 6.7) between the two 20-year periods yields a significant difference at 10 of the 105 stations (p<0.05); all 10 stations are in the western clusters or N cluster and in each case variance is higher during the second 20-year period. The CPT annual cluster mean exhibits a particularly large increase in variance between the two periods (F≈2.5 (p<0.05), where F>1 implies larger variance in the latter period). Large but statistically insignificant differences are also observed in the SW (F≈2), NW (F≈1.7) and S (F≈1.6) annual variability clusters; for all other clusters F is close to 1.
4.4 CWT–rainfall associations and its relation to seasonality and variability
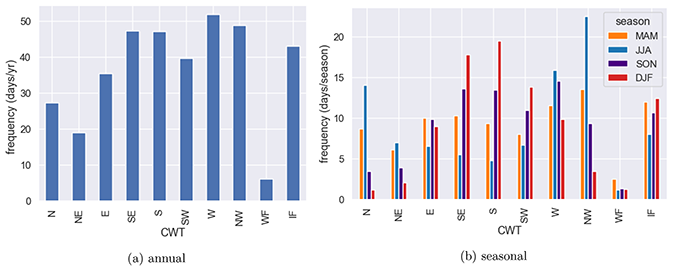
In search of mechanisms driving the observed spatial structure of variability and seasonality in the WRZ, we now consider observed rainfall by CWT (in this study, effectively, wind direction). The observed seasonal frequencies of CWTs are consistent with the conventional description of Cape Town's wind climate (Fig. 6). Two wind directions are dominant: W–NW (most common overall) winds in winter and S–SE winds in summer, as the austral westerlies migrate poleward and the WRZ comes under the dominant influence of the eastern flank of the South Atlantic High Pressure Cell (Reason, 2017; Sun et al., 2017). More interesting is the notable asymmetry between the two shoulder seasons. Spring (SON) is characterised by more frequent winds from southerly than northerly sectors (≈36 vs. 26 d per season), autumn (MAM) by the opposite (≈29 vs. 16 d per season). Since heavier rains tend to fall with northerly winds compared to southerly winds in the southern WRZ (in the northern WRZ southerly flow rarely leads to any rain; not shown), this shoulder season asymmetry may explain the differences between rainfall seasonality and rain day seasonality described in Sect. 4.2.2. Results presented here are from ERA5, but qualitative patterns are equivalent in ERA-Interim. The largest difference between them is the less frequent occurrence of WF events in ERA5 (≈5 vs. 10 d yr−1) associated with higher mean wind speeds (not shown).
In Fig. 7 the spatial pattern of rainfall by CWT and grouped CWTs is shown, which explains much of the spatial structure of seasonality and variability. In particular, %AMJJAS closely corresponds to the CWT contributions from westerly sectors (Fig. 7b). Denoting by W_all the sum of contributions from the SW, W and NW CWTs and W–NW the sum over contributions from the W and NW CWTs, correlations with %AMJJAS are , , , and , where ρS denotes the Spearman rank correlation (see von Storch and Zwiers, 1999, Sect. 8.2). Correlations with S–SE contributions (Fig. 7c) are similar in magnitude but opposite in sign. Contributions by CWT closely align with relative location in the study domain; contributions from S–SE winds are greatest along the south- and south-east-facing zonal Cape Fold Belt (Fig. 7c), from SW winds in the far south-west, from N–NE winds along the north-eastern slopes of the escarpment and from the W–NW winds from the meridional Cape Fold Belt westward. Significant topographic barriers result in steep changes in CWT contributions, likely explaining sharp seasonality and variability boundaries described in Sects. 4.2 and 4.3.
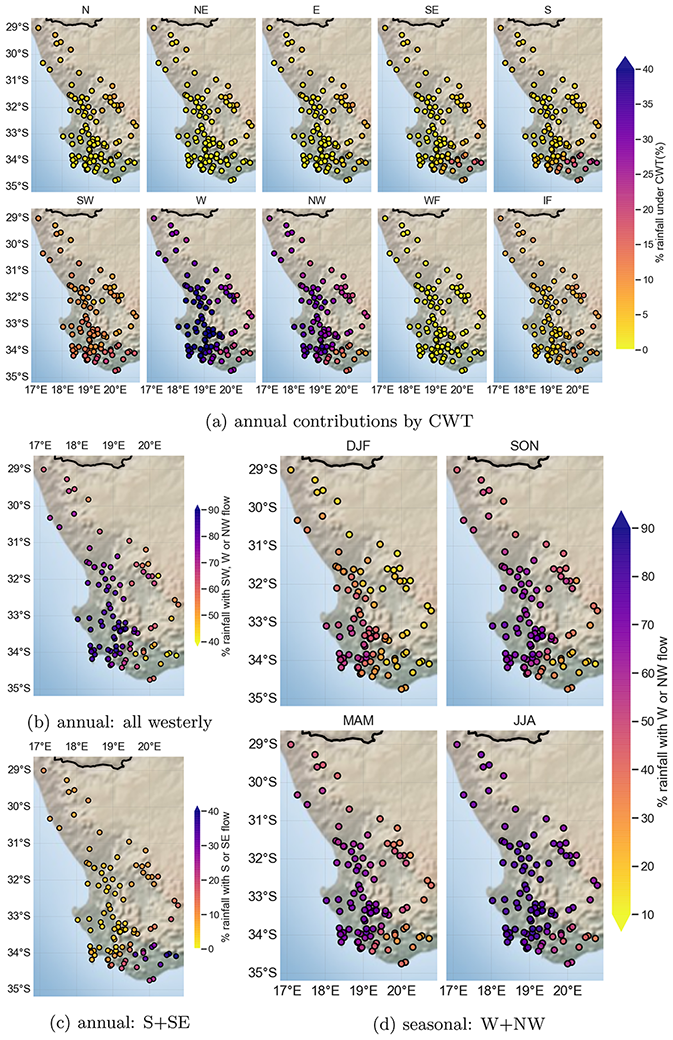
Figure 7Maps of CWT rainfall contribution (a) annually for all CWTs, the sum of contributions from (b) all westerly sectors and (c) from the S and SE and (d) the seasonal sum of contributions from the W and NW CWTs.
Clustering by CWT contributions yields very similar patterns to seasonality and variability clusters (Fig. 8a). The same stations identified in Fig. 3 as YRZ stations are clustered together as the All-Year CWT cluster. They are clearly distinguished from the other clusters by a maximum CWT contribution from S (compared to W in all other clusters) and by receiving little more than 10 % of rainfall from the NW (compared to about 35 % at south-western stations). In fact, the All-Year CWT cluster is the only CWT cluster receiving below-average daily rainfall under the NW CWT and the only CWT cluster receiving above-average daily rainfall under the SE CWT.
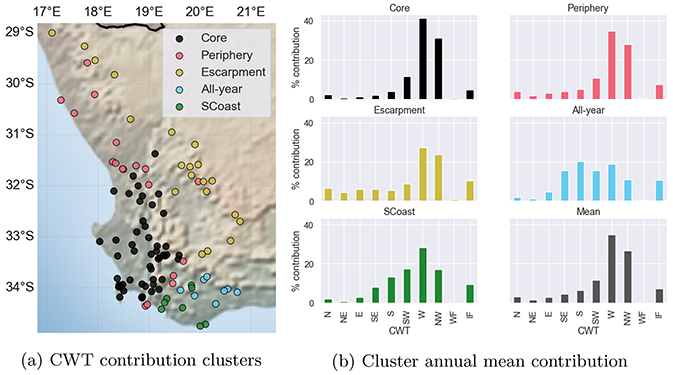
Figure 8Map of CWT contribution clusters (five) and corresponding cluster mean CWT contributions as well as overall spatial mean CWT contributions.
The three primary patterns of seasonal variation in CWT rainfall contributions can be summarised using three CWT groups (Figs. 7d and A3). The CPT annual variability cluster stations mostly receive >70 % of summer (DJF) rainfall from W_all and ≈60 % from W–NW CWTs (Fig. 7d). The rest of the Core CWT cluster receives 40 %–60 % of DJF rainfall from W–NW CWTs, while very few stations in the other CWT clusters receive >30 % of DJF rainfall from W–NW CWTs. During JJA, all stations except those in the All-Year CWT cluster receive >50 % of rainfall from the W–NW CWTs (Fig. 7d). Stations in the south and south-east, especially in the All-Year CWT cluster, receive most of their rain from the S–SE in SON and DJF (Fig. A3a). Rain east of the escarpment during DJF (and to a lesser extent MAM) occurs much more frequently with N–NE (Fig. A3b) and IF (not shown) CWTs than elsewhere in the study domain, suggesting local convective activity.
5.1 Approach used to develop the framework
Using rainfall seasonality alone cannot distinguish the southern WRZ core from the northern WRZ periphery, despite the latter differing from the former in variability, rain-bearing wind seasonality, rain-bearing systems and the summer contribution to variability. We propose that understanding the WRZ spatial structure requires understanding of both the mean and variability of seasonality. Hence we use the 5th percentile AMJJAS contribution to annual totals (denoted by q5%AMJJAS) as a measure of the reliability of the winter season contribution to the annual total. Using a percentile-based approach allows meaningful comparison between datasets. We propose a spatial subdivision of South-Western Southern Africa based on %AMJJAS and q5%AMJJAS. The hierarchical structure is conceptually illustrated in Fig. 9. Thresholds are chosen to yield as spatially coherent a meaningful classification as possible, but in reality all boundaries are fluid. Data quality shortcomings and extreme events within the chosen time period, especially at arid stations, limit the robustness of the approach applied at the station scale. We present a simple decomposition of the study domain (Fig. 10a–c), which is highly consistent between the three datasets described in Sect. 3.1, and an extended decomposition (Fig. 10d and e; not shown for the southern African dataset as the results are too spatially incoherent due to the short and variable periods of record). The extended decomposition, in addition to %AMJJAS and q5%AMJJAS, uses the ratio of autumn to spring mean rainfall to distinguish northern from southern sections of the periphery, transition and surroundings.

Figure 9Conceptual model of the subregional decomposition of South-Western Southern Africa proposed here.
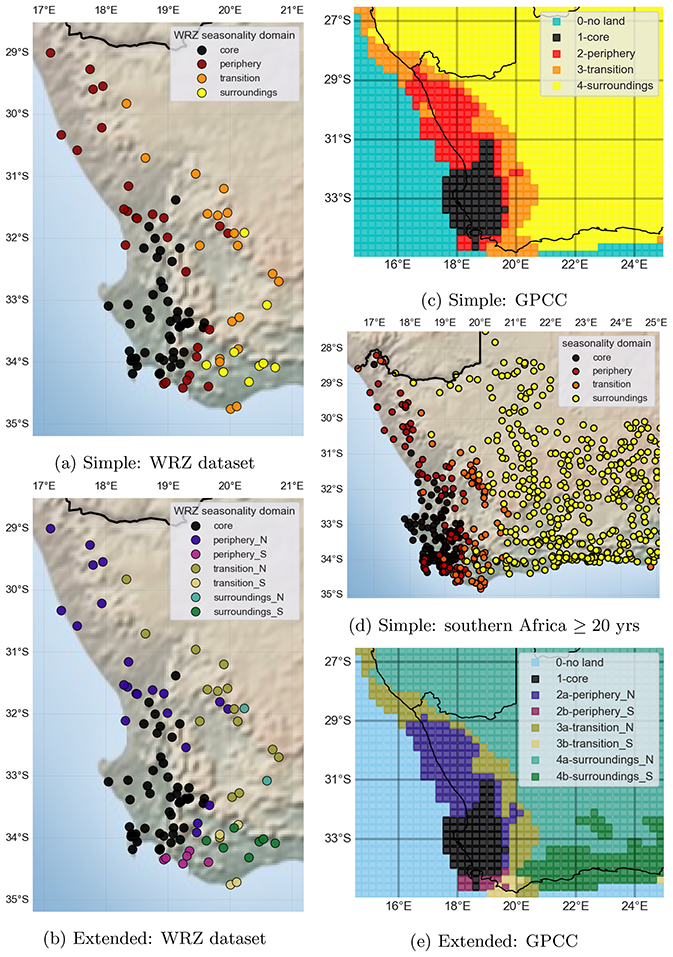
Figure 10Seasonality domains in (a, b) the WRZ dataset, (c, e) GPCC and (d) southern African datasets. The extended version classification is presented in (b) and (e).
5.2 Subdomains
The obtained spatial structure is illustrated in Fig. 10. The subdomains are the following.
-
The true WRZ is a coherent area between the west coast and the spine of the western escarpment. Seasonality of rainfall and rain days is qualitatively similar across this area. Low- and high-frequency rainfall variability is dominated by common signals. There is a unimodal winter rainfall peak, almost always in June.
-
The core WRZ lies within the true WRZ, distinguished by having interannual variability dominantly driven by AMJJAS. It is situated in the south-west, including Cape Town, the Boland Mountain Cluster, meridional Cape Fold Belt chains, and the Swartland (see Fig. 1). Seasonality and rainfall contributions by CWT are near uniform spatially. Summer rainfall is still largely from the western sector CWTs and hence relatively reliable, presumably resulting in the AMJJAS dominance of interannual variability. Despite the fine-scale complexity apparent in the core, there is little spatially coherent substructure that can be diagnosed with the available station density and quality, as it is inconsistent between the three datasets. Specifically, in contrast to previous studies (e.g. Rebelo et al., 2006) and GPCC, WRZ stations with %AMJJAS≥80 form a spatially disjointed set rather than being concentrated around the Berg River mouth. There are pockets where %AMJJAS≥80 in the north-western Boland Mountain Cluster, the Cedarberg, Cape Town east of Table Mountain and even the Kamiesberg.
-
The periphery is the true WRZ outside the core. Relative to the core, the periphery receives a considerably larger rainfall contribution from COLs (Favre et al., 2013; Abba Omar and Abiodun, 2020). At least one shoulder season (usually spring in the south and autumn in the north) tends to receive a larger share of MAR relative to the core.
-
The southern periphery is a small coastal belt south and immediately south-east of the core. It is similar to the core in almost all respects but with a reduced-amplitude seasonality driven largely by more light rain from the south and south-west in SON and DJF. Much of this rain is presumably frontal or post-frontal (Deacon et al., 1992; Cowling et al., 2009), associated with the passage of weaker fronts that brush past the southern tip of the continent. The low-frequency variability amplitude is lower than in the core.
-
The northern periphery is a much larger region, including most of Namaqualand and stretching along a narrow margin in the lee of the meridional Cape Fold Belt. In contrast to the southern periphery, its seasonality is very similar to the core but with far fewer rain days and consequently less stable seasonality. It receives a notably larger rainfall contribution from northerly and IF CWTs, especially in summer and autumn. The 13-year quasi-oscillatory mode is enhanced relative to the core. Roughly 65 % of variance in annual totals is shared between the core and northern periphery compared to only about 50 % with the southern periphery.
-
-
-
The transition zones combine seasonality and variability characteristics of both the WRZ and YRZ (southern transition) or late SRZ (northern transition). A second rainfall peak (in addition to June) occurs in April across the transition zone, and in the south a third peak in October–November is apparent. A mid-summer rainfall minimum still occurs, but ONDJFM tends to dominate temporal rainfall variability, which is strongly correlated with the adjacent periphery (R2≈0.75), especially in the north (R2>0.8). However, rainfall variability of the northern transition is almost unrelated to that of the southern transition (R2≈0.12).
-
The WRZ's surroundings have no winter peak in rainfall and as such are definitely not part of the WRZ. The northern surroundings mostly fall in the late SRZ, although a broad and complex transitional area exists characterised by multiple competing seasonality influences. The southern surroundings fall within the YRZ.
6.1 CWT rainfall contributions and spatial structure
Coherence of variability, seasonality and CWT contributions between wet and dry regions in the true WRZ suggests common primary drivers exist; this is particularly true within the core. Consequently, to maximise robustness of findings, spatial disaggregation within the core for rainfall variability studies is not advisable. However, there is also strong evidence for heterogeneity in drivers between the true WRZ, the transitions and the surroundings. The spatial gradient in %AMJJAS from the core to the surroundings is closely aligned with a corresponding gradient in the proportion of rainfall received from westerly CWTs and, hence, presumably, from weather systems in the westerlies with associated westerly moisture sources. Orographic enhancement and its relationship with CWT contributions have long been identified as crucial in the region (e.g. Wicht, 1940; Desmet and Cowling, 1999; Reason, 2017) but appear to be very complex: we find robust large-scale influences but also suggestions of local-scale nuances (cf. Moses, 2008; Mbali, 2016) that would require much higher station densities to explore.
CWT–rainfall relationships provide insight into the distinction between the northern periphery and the core. Despite having similar seasonality to the core, temporal variability and rain-bearing wind patterns in the northern WRZ are peripheral: during all seasons, less rainfall is received with westerly (mostly frontal) winds. Presumably this is because of only the most intense fronts making landfall in the northern WRZ – as indicated by uniformly much lower rain day climatologies across sizeable MAR gradients – and consequently a greater influence of COLs on interannual rainfall variability. Additionally, irregular late summer thunderstorms – usually in conjunction with IF, N, NE or E CWTs (see Fig. A3c) – have a large impact on annual rainfall totals in some years (Desmet and Cowling, 1999; Bradshaw and Cowling, 2014; Helme and Schmiedel, 2020).
The core WRZ is better characterised by the relative rainfall contributions of rain-bearing systems than by rainfall seasonality. Even during DJF, the core – uniquely – receives most of its rainfall from systems in the westerlies (Fig. A3a). This is probably related to the South Atlantic High exhibiting the smallest seasonal variation in latitude among the SH subtropical anti-cyclones and the most poleward position in summer, allowing for a more northerly frontal track (Rudeva et al., 2019). Hence, probably uniquely among subtropical Mediterranean-like climate zones, rainfall seasonality in the WRZ core is driven almost exclusively by variability in land-falling westerly storms, with little influence from systems embedded in the tropical easterlies. As wind and moisture belts shift in response to climate change (e.g. Sousa et al., 2018; Burls et al., 2019), this difference between the core WRZ and its surroundings may result in strongly differing climate change responses.
6.2 COL rainfall contributions as a determinant of spatial structure
Wolski et al. (2021) identified COL rainfall contributions from Favre et al. (2013) and Abba Omar and Abiodun (2020) as closely related to variability clusters in the southern WRZ. The periphery and transition (as defined in Sect. 5) are associated with progressively larger COL contributions to total rainfall and may be an important contributor to seasonality and variability differences relative to the core, where COL rainfall contributions are low. COLs may be particularly influential in the less stable seasonality in the periphery and transition. The surroundings also have a larger COL contribution to total rainfall.
6.3 Implications for the YRZ and WRZ–YRZ transition
The sharp distinction between the temporal rainfall variability patterns in the WRZ and south-western YRZ is presumably a consequence of NW winds yielding below-average and SE winds above-average daily rainfall in the YRZ, unlike in the WRZ and transitional regions. This finding lends support to the modelling results of Engelbrecht et al. (2019), suggesting that the YRZ – and particularly the south-facing zonal Cape Fold Belt slopes – received less rainfall when the austral westerly storm track was shifted equatorward during the Last Glacial Maximum, resulting in enhanced north-westerly flow. More research is, however, required to understand the drivers of spatial patterns of winter rainfall variability in the YRZ and its relation to the WRZ. In particular, the spatial coherence of YRZ variability and the relationship between core YRZ climatology and the climatology of its north-western extension are poorly understood (Engelbrecht et al., 2015). However, when considered in conjunction with Engelbrecht et al. (2015), Engelbrecht and Landman (2016) and Reason (2017), the findings presented here clearly support the notion that the WRZ and YRZ have fundamentally distinct climatic drivers (e.g. Desmet and Cowling, 1999; Cowling et al., 1999; Goldblatt and Manning, 2002) rather than the conceptualisation of the YRZ as essentially a transitional zone between the WRZ and SRZ that combines climatological influences of each (e.g. Faith et al., 2019; Chase et al., 2017; Dieppois et al., 2016; Tyson, 1999). Furthermore, the importance of summer rainfall for annual variability suggests that understanding drought and future change in the periphery and transition requires greater focus on drivers of summer variability than has previously been forthcoming. These findings are also consistent with suggestions that, on palaeoclimatic timescales, summer rainfall variability has dominated overall drought stress signals in the WRZ periphery (MacPherson et al., 2018; Chase et al., 2019).
We study rainfall seasonality and variability in southern Africa's WRZ in its regional context (South-Western Southern Africa) through the lens of rainfall–wind direction relationships. Our primary findings regarding the WRZ can be summarised thus:
-
A well-defined, relatively homogeneous true WRZ with spatially coherent variability and seasonality is situated along the west coast, meridional Cape Fold Belt and western escarpment between Cape Town and the Gariep River mouth.
-
The true WRZ corresponds very closely to those locations receiving ≳70 % of MAR from winds in the westerly sectors, mostly (≳70 %) – and reliably – in AMJJAS.
-
The true WRZ can be subdivided meaningfully into three further subdomains, the core and the southern and northern peripheries, corresponding roughly to the SW, SE and N clusters of Wolski et al. (2021).
-
The core covers most of the southern WRZ. It is surprisingly homogeneous in seasonality and variability despite the fact that the MAR ratio between the driest and wettest core WRZ stations exceeds 10, while the MAR range in the true WRZ spans a factor of 50.
-
Variability patterns in the core are dominated by AMJJAS signals, with evidence for important quasi-periodic variability at approximately 40-, 20- and 6-year timescales.
-
With distance from the core, the summer influence on interannual variability increases at a greater rate than its contribution to MAR.
The most important findings regarding South-Western Southern Africa are the following.
-
The region is characterised by large heterogeneity in rainfall seasonality and temporal variability patterns. Spatially abrupt transitions occur from the WRZ to the surrounding YRZ and late SRZ. The complementary use of continuous and discrete seasonality metrics to understand this heterogeneity is advised, as is done in Roffe et al. (2020).
-
The eastern Boland Mountain Cluster and western escarpment are regions of spatially abrupt and complex seasonality transitions, including areas of non-monotonic change in %AMJJAS.
-
Along a narrow band immediately south (windward) of the zonal Cape Fold Belt, the YRZ extends much further westward than has previously been reported.
-
This western YRZ incursion is characterised by fundamentally distinct rainfall variability patterns, annually and in AMJJAS, tied to clearly distinct CWT–rainfall contributions. This is inconsistent with the common conceptualisation of the YRZ as a simple combination of WRZ and SRZ influences.
The coherence of spatial patterns of seasonality and variability between coastal plains, mountains and intermontane valleys – greatly differing in MAR – strongly supports the use of relative or normalised anomalies when studying WRZ rainfall variability. In particular, we would discourage using MAR explicitly or implicitly for station subsetting (as in e.g. Philippon et al., 2012; Burls et al., 2019). However, despite this coherence and the small size of the WRZ relative to Mediterranean-like climate regions globally (Aschmann, 1973; Seager et al., 2019), care should be taken in selecting regions of interest for WRZ rainfall variability and change assessments. Otherwise distinct variability signals driven by fine-scale heterogeneity in seasonality and variability in South-Western Southern Africa may easily be conflated.
It should be noted that the 40-year data period of this study is relatively short given the dominant role of multi-decadal variability in WRZ rainfall (Wolski et al., 2021; Burls et al., 2019; Ndebele et al., 2019; Dieppois et al., 2016). Furthermore, spatial aggregation and generalisability of the results are hampered by the absence of reasonable-quality long-term daily records in the wettest mountain locations. As such, some quality concerns remain for stations included in this study in the interest of spatial representativity, even after extensive quality control is applied. While it is unlikely to dramatically alter the qualitative patterns observed, the assumption of uniform rain rates during each 6 h subperiod of the 24 h rainfall recording period is crude. It is made to allow comparison between the available rainfall data (daily) and higher temporal resolution wind data (6-hourly) required to capture transient weather systems. Finally, the clustering methodologies employed are all somewhat sensitive to arbitrary parameter choices. Future studies seeking a more nuanced understanding of spatial patterns and transitions in South-Western Southern Africa would be well advised to apply fuzzy clustering approaches. However, for the purpose of this work – gaining improved qualitative understanding of the finer-scale spatial patterns of variability and seasonality of the WRZ and their relationship with wind direction – the approaches employed allow us to demonstrate and explain both remarkable homogeneity in rainfall patterns in the west and complex fine-scale patterns of transition to the east.
A1 Detailed description of WRZ dataset station selection
A1.1 DWS station selection
All South-Western Southern African DWS stations for which daily data are available from October 1980 (the start of DWS daily rainfall records) were included, with the exception of Theewaterskloof Dam, whose records were judged to be inconsistent with surrounding stations. The decision to include DWS stations under less stringent conditions than SAWS stations was motivated by their location in important water source regions, frequently at higher elevations. The Ceres Dam station, which started reporting only in 1999, is also included, as its rainfall is found to be closely related to surrounding lower-elevation stations at the daily timescale, making infilling of the missing data relatively reliable, and because it is the only known station north of the Boland Mountain Cluster recording MAR>1500 mm. Data for all DWS stations were obtained up to December 2018, except for Clanwilliam Dam, which stopped reporting in 2014; the nearby Clanwilliam AWS SAWS station (reporting since 2001) was found to be sufficiently similar during the period of overlap, so that, after mean adjustment, it could serve as a replacement series for 2014–2018.
SAWS stations not satisfying the 95 % or 90 % criteria outlined in Sect. 3.1.2, but for which a record is also available from DWS and/or CoCT, were also included in the study.
A1.2 Nearest-neighbour stations
Gauges selected as nearest neighbours have shorter but reliable periods of record and are situated near stations in the WRZ dataset or in poorly sampled regions. These stations include CoCT stations and a number of newer automatic SAWS gauges.
A2 Description of the WRZ dataset cleaning methodology
The iterative procedure applied for data cleaning involves the following 12 steps.
-
The data cleaning procedure used by Wolski et al. (2021) is first applied. Data obtained from SAWS have been subjected to SAWS internal data cleaning, although a description of this procedure is not publicly available and has evolved in time, so that differences may have occurred in the cleaning conducted between different updates received from SAWS. DWS also performs data cleaning on their daily data, but this procedure, too, is not publicly documented.
-
Spurious sequences of dry days are identified, which presumably should have been missing. If the estimated probability of a given sequence of dry days is less than 0.25 %, the sequence is replaced by missing values. This procedure identified a number of such instances, most notably where 25 SAWS manual gauges in the south-western Cape reported no rainfall at all for throughout JAS 1999, while surrounding stations received frequent, near-normal rainfall.
-
Sequences with more than 2 consecutive days with equal non-zero rainfall are also removed. Such sequences generally appear to result from cumulative rainfall totals (often, but not always, for a month) being distributed uniformly across all days in that period.
-
To ensure convergence of the GAMLSS fits, as large as possible a sample of days is required and bias in missing value occurrence needs to be minimised. Hence an initial infilling is done using mean-adjusted CCW. Because of the large differences in mean rainfall occurring over short distances, we use the squared Spearman rank correlation as the correlation measure. The estimated rainfall is computed using four to six nearest neighbours.
-
For manually selected stations, over periods for which climatologically very similar surrounding stations (up to a maximum of three) are reporting, CCW on this fixed set of stations is used instead. This predictor is preferentially used over other predictors, throughout the procedure, although the set of stations for which this nearest-neighbour (NN; Pegram and Bárdossy, 2013) approach is used is reduced once the GAMLSS predictor is available (see point 10). Some of these stations (e.g. Brooklands, Molteno Reservoir, Porterville AWS, and Hermanus AWS) are not part of the main WRZ dataset and are used only for infilling due to short periods of record. Automatic stations are preferred for this purpose as they are found to report rain days more consistently (see points 6 and 8).
-
Incorrect reporting of the day of rainfall in South African records is common (Smithers and Schulze, 2000). Daily rainfall is supposed to be measured over 24 h periods from 08:00 to 08:00 SAST and recorded under the date of the start of this period. However, often it is recorded under the day when the reading is taken, and this malpractice may persist for periods of days, weeks or months at a time before reverting to the correct practice. Consequently we apply time shifting in cases where the occurrence of rainfall is found to be inconsistent with surrounding stations and the sequence shifted forward or backward by 1 d is much more consistent with surrounding observations. More precisely, rainfall series are shifted back by 1 d, when, over the period from day t0 to tn,
where r(t) is the rainfall recorded at the station on day t and m(t) is the corresponding value expected (or modelled) using the approaches from points 4 or 5 above; an equivalent procedure is employed for forward shifting. Time shifting is applied iteratively until near convergence to allow for shifts by a few days and for adjustments if corrections to surrounding stations render a potential shift more desirable or a prior shift unnecessary. At very dry stations the procedure can get stuck in a loop, so complete convergence is not achievable.
-
Where records from different institutions for the same station on the same day disagree, source selection is conducted. In such cases, the value most consistent with the surrounding stations (using an approach analogous to expression A1) is selected. This is done on time-shifted versions of each of the institutional time series to ensure that differences are unlikely to be due to one recorded being a time-shifted version of another.
-
Suspiciously large single-day rainfall values following a sequence of zeroes or missing values are assumed to represent cumulative totals since the last non-zero non-missing value. These cumulative totals are then distributed over previous days in proportion to the CCW–NN (using NN estimates where available and CCW otherwise) expected rainfall values.
-
Other suspiciously large rainfall values, greater than 9 times the value expected from CCW–NN, are assumed to be the result of decimal errors and are divided by 10.
-
After the above cleaning and infilling operations have been conducted, a GAMLSS is fit for the zero-inflated Gamma distribution (ZIG) (Rigby and Stasinopoulos, 2005, see Schoenach et al., 2020, Appendix A, for a brief overview of the GAMLSS framework). This approach and distribution allow one to separately model the mean rainfall value, the variance of this estimate and the probability of non-zero rainfall at a station on a given day as a function of rainfall values at selected surrounding stations and the day of the year. Potential predictor stations are iteratively added to the model until at least three terms are included and thereafter are retained if the Schwarz Bayesian criterion (SBC) (Schwarz, 1978) is reduced by their inclusion. The station achieving the highest value of (ρS)2 with model residuals multiplied by a measure of the frequency of co-occurrence of rainfall at the target and candidate stations is selected as the next predictor. Missing values are replaced by 0 when a binomial random number generator with probability set to the modelled probability of rainfall at that station returns 0; otherwise it returns the mean value of the fit, i.e. rainfall occurrence is stochastically modelled, but rainfall amounts on rain days are deterministic.
-
Since the probabilities of a dry day and the probability of exceeding a particular rainfall amount can now be estimated rigorously using the fits obtained in step 10, steps 2 and 9 can be repeated with more robust probability estimates.
-
After this more robust cleaning procedure is run, the GAMLSS fit is performed again. This final output is then used as the WRZ dataset.
A3 Software used
-
The data cleaning procedure is run in R (R Core Team, 2018) using the
gamlsspackage (Stasinopoulos and Rigby, 2007). -
Clustering is performed using the
Scikit-learnpackage (Pedregosa et al., 2011). -
Fourier decompositions are performed with metR (Campitelli, 2020).
-
Simple statistical manipulation on the WRZ dataset is performed using the tidyverse (Wickham et al., 2019) and time series plotting using ggplot2 (Wickham, 2009) in R.
-
The CWT analysis is performed in python using xarray (Hoyer and Hamman, 2017; Hoyer et al., 2016).
-
Spatial plots and maps are produced using the python libraries basemap and cartopy (Met Office, 2010–2020).
-
For preprocessing, the climate data operators (cdo; Schulzweida, 2019) and the KNMI climate explorer (van Oldenborgh et al., 2009) are used.

Figure A1Equivalent of Fig. 3 for the southern African dataset, including all southern African dataset stations over South-Western Southern Africa with at least the equivalent of 20 years of complete data.
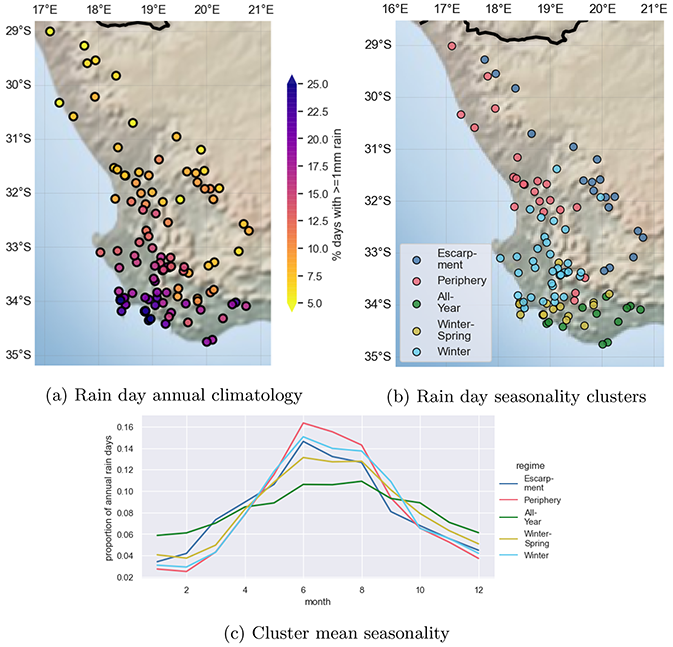
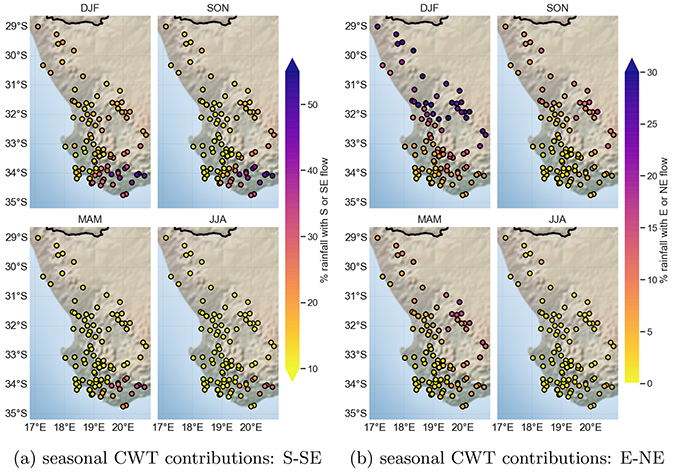
Figure A3Seasonal contributions from grouped CWTs: as in Fig. 7d but for (a) S–SE and (b) E–NE (note differences in scales).
Table A1List of abbreviations used in the text and/or figure labels.

Table A2Stations used in the WRZ dataset.
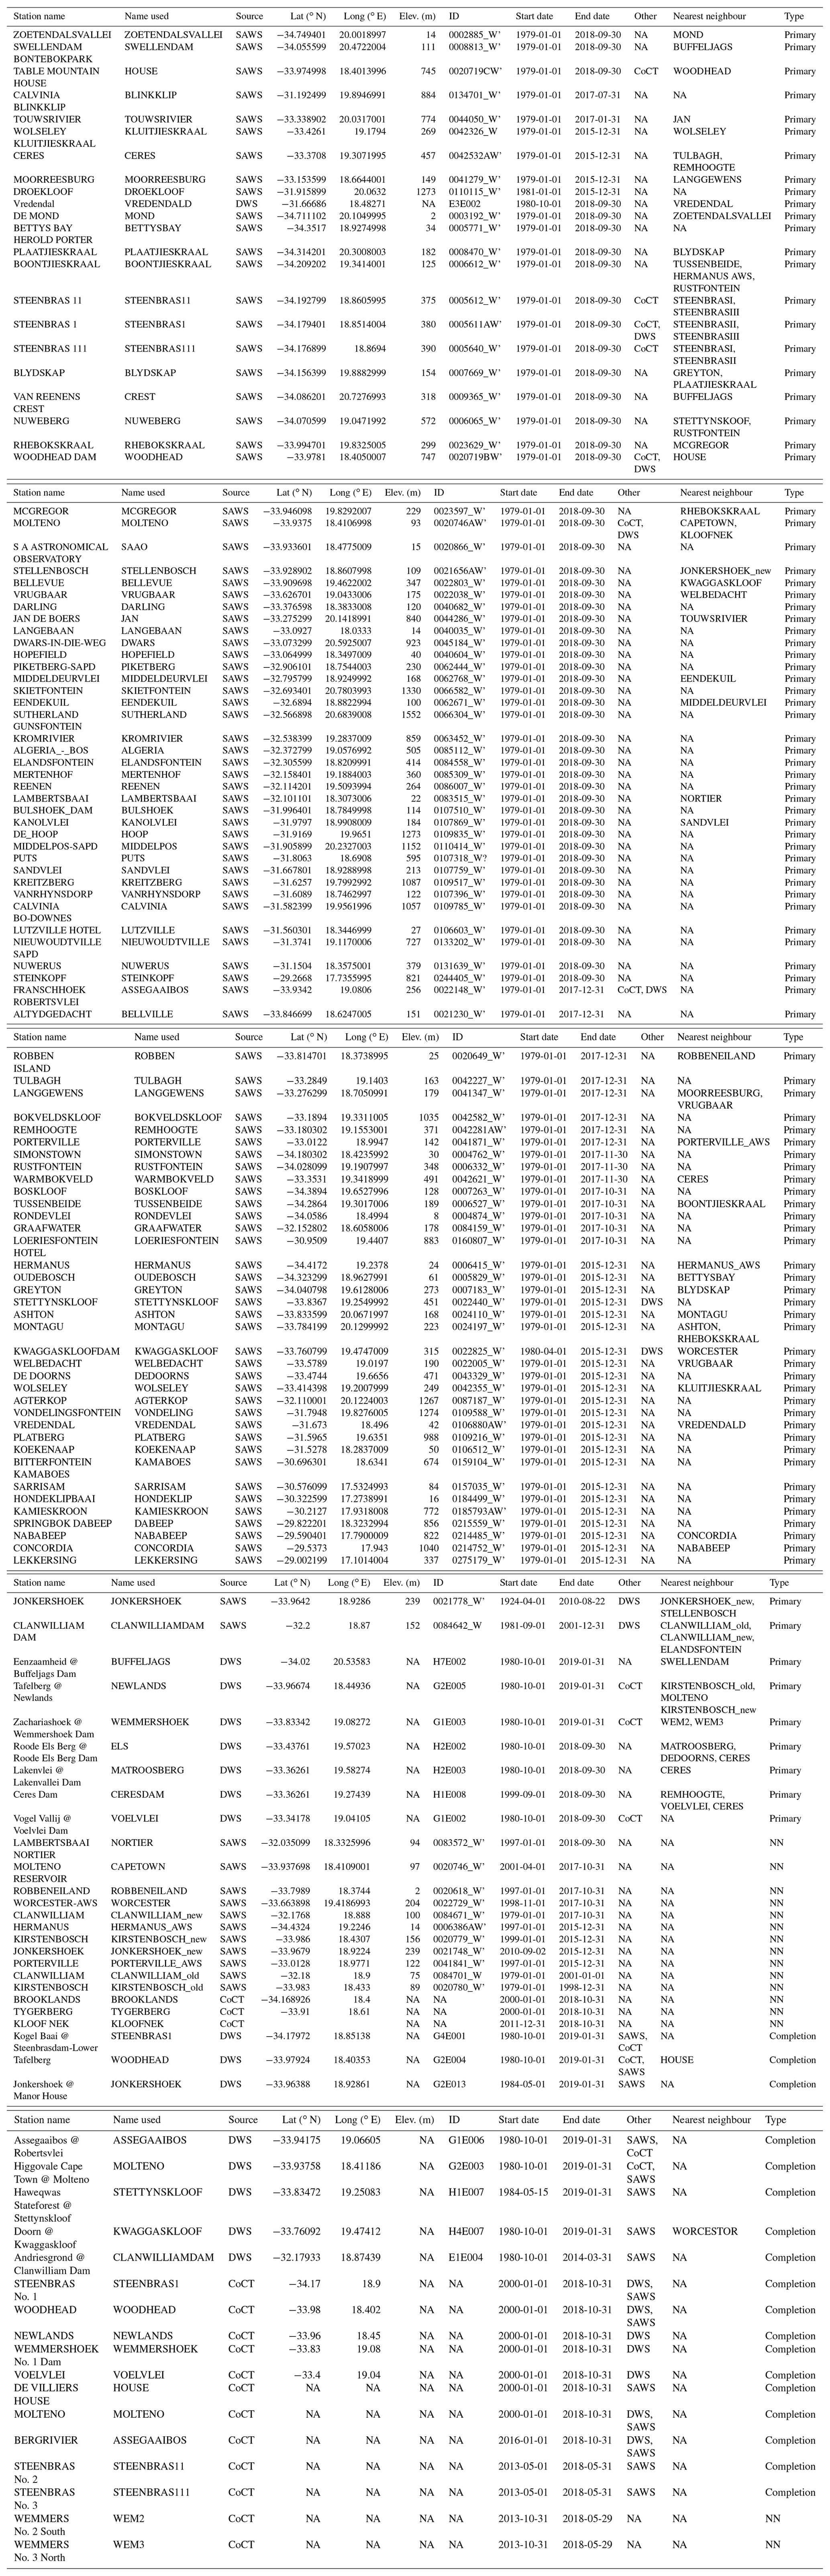
The first column (“Station name”) contains the names data providers use for their stations; the second column (“Name used”) contains the name of the station used in our study. This name may differ from the original to ensure that the same name is used for all records from a given station, to ensure uniqueness where multiple stations have the same name, or in the interest of shortness and familiarity. The “Source” column identifies the institution providing the data; the latitude (“Lat”), longitude (“Long”) and elevation (“Elev.”) of the station provided by this institution are then listed (NA if none is provided), followed by the ID code it uses to identify the station and the start and end dates of their record used here. The “Other” column lists other institutions with records for the same station. The “Nearest neighbour” column indicates whether nearest neighbour infilling is preferentially employed for a given station, in this case listing the stations used as its neighbours; “NA” indicates that nearest-neighbour infilling is not applied for this station. The “Type” column indicates whether the record is a primary record for a station in a dataset (“Primary”), used exclusively as a nearest neighbour (“NN”), or to extend the period of record of a primary record forward or backward (“Completion”).
Code for the clustering, mapping, CWT processing and plotting as well as spatial subdivision in GPCC data is available are available at https://doi.org/10.25375/uct.16546008 (Conradie et al., 2021). Code for the data cleaning procedure is available at https://doi.org/10.25375/uct.18856337 (Conradie et al., 2022a). Any additional code may be requested from the first author. The South African Weather Service (SAWS) data policy does not allow sharing or dissemination of their rainfall data. SAWS data can be requested for research purposes from info4@weathersa.co.za, in line with their data policy. City of Cape Town (CoCT) Bulk Water rainfall data are available upon request for research purposes and may be obtained from Lloyd Fisher-Jeffes (lloyd.fisherjeffes@capetown.gov.za). The Department of Water Affairs and Sanitation (DWS) rainfall data are available for free download at https://www.dws.gov.za/Hydrology/Verified/hymain.aspx (DWS, 2020). The GPCC version 2018 rainfall climatologies can be downloaded from the DWD: https://doi.org/10.5676/DWD_GPCC/CLIM_M_V2018_025 (Meyer-Christoffer et al., 2018). The ERA5 wind vector data can be obtained freely from the Copernicus Climate Data Store (https://doi.org/10.24381/cds.adbb2d47, Hersbach et al., 2018).
WSC led the conceptualisation and planning of the paper, with input from BCH and PW. Data were obtained by WSC. The code and figures were produced by WSC, with input from PW. The first draft was written by WSC and subsequent editing done by all the authors.
The contact author has declared that neither they nor their co-authors have any competing interests.
Publisher's note: Copernicus Publications remains neutral with regard to jurisdictional claims in published maps and institutional affiliations.
The considerable help, support and encouragement with the GAMLSS procedure by Birgit Erni of the UCT Department of Statistical Sciences are greatly appreciated. We would like to thank the South African Weather Service for providing most of the rainfall data used in this study. The City of Cape Town is also thanked for supplying rainfall data and the South African National Department of Water and Sanitation (DWS) for making their rainfall data freely accessible. Willem Stefaan Conradie was partially funded under a South African National Research Foundation (NRF) grant no. 121047. Technical support provided by Phillip Mukwenha and Rodger Duffer is greatly appreciated. Helpful reviewer comments from Sarah Roffe and Dáithí Stone improved the clarity of the manuscript appreciably.
This research has been supported by the National Research Foundation (grant no. 121047).
This paper was edited by Michael Wehner and reviewed by Sarah Roffe and Dáithí Stone.
Abba Omar, S. and Abiodun, B. J.: Characteristics of cut-off lows during the 2015–2017 drought in the Western Cape, South Africa, Atmos. Res., 235, 104772, https://doi.org/10.1016/j.atmosres.2019.104772, 2020. a, b, c, d
Abba Omar, S. and Abiodun, B. J.: Simulating the characteristics of cut-off low rainfall over the Western Cape using WRF, Clim. Dynam., 56, 1265–1283, https://doi.org/10.1007/s00382-020-05532-8, 2021. a
Archer, E., Landman, W., Malherbe, J., Tadross, M. A., and Pretorius, S.: South Africa's winter rainfall region drought: A region in transition?, Clim. Risk Manage., 25, 100188, https://doi.org/10.1016/j.crm.2019.100188, 2019. a
Aschmann, H.: Distribution and Peculiarity of Mediterranean Ecosystems, in: Mediterranean Type Ecosystems, edited by: di Castri, F. and Mooney, H. A., Springer, Berlin, Heidelberg, Chap. 1, 11–19, https://doi.org/10.1007/978-3-642-65520-3_2, 1973. a, b, c
Barrable, A., Meadows, M. E., and Hewitson, B. C.: Environmental reconstruction and climate modelling of the Late Quaternary in the winter rainfall region of the Western Cape, South Africa, S. Afr. J. Sci., 98, 611–616, 2002. a
Bayer, M. B.: The Cape flora and the Karoo – a winter rainfall biome versus a fynbos biome, Veld and Flora, 70, 17–19, 1984. a
Becker, A., Finger, P., Meyer-Christoffer, A., Rudolf, B., Schamm, K., Schneider, U., and Ziese, M.: A description of the global land-surface precipitation data products of the Global Precipitation Climatology Centre with sample applications including centennial (trend) analysis from 1901–present, Earth Syst. Sci. Data, 5, 71–99, https://doi.org/10.5194/essd-5-71-2013, 2013. a
Blamey, R. C., Ramos, A. M., Trigo, R. M., Tomé, R., and Reason, C. J. C.: The influence of Atmospheric Rivers over the South Atlantic on Winter Rainfall in South Africa, J. Hydrometeorol., 19, JHM-D-17-0111.1, https://doi.org/10.1175/JHM-D-17-0111.1, 2017. a
Born, J., Linder, H. P., and Desmet, P. G.: The Greater Cape Floristic Region, J. Biogeogr., 34, 147–162, https://doi.org/10.1111/j.1365-2699.2006.01595.x, 2007. a
Bradshaw, P. L. and Cowling, R. M.: Landscapes, rock types, and climate of the Greater Cape Floristic Region, in: Fynbos, Oxford University Press, 26–46, https://doi.org/10.1093/acprof:oso/9780199679584.003.0002, 2014. a, b, c, d, e, f, g, h
Burls, N. J., Blamey, R. C., Cash, B. A., Swenson, E. T., al Fahad, A., Bopape, M.-J. M., Straus, D. M., and Reason, C. J. C.: The Cape Town “Day Zero” drought and Hadley cell expansion, npj Climate and Atmospheric Science, 2, 27, https://doi.org/10.1038/s41612-019-0084-6, 2019. a, b, c, d, e, f, g
Campitelli, E.: metR: Tools for Easier Analysis of Meteorological Fields, R package version 0.8.0, Zenodo [code], https://doi.org/10.5281/zenodo.2593516, 2020. a
Chase, B. M. and Meadows, M. E.: Late Quaternary dynamics of southern Africa's winter rainfall zone, Earth-Sci. Rev., 84, 103–138, https://doi.org/10.1016/J.EARSCIREV.2007.06.002, 2007. a, b
Chase, B. M., Quick, L. J., Meadows, M. E., Scott, L., Thomas, D. S., and Reimer, P. J.: Late glacial interhemispheric climate dynamics revealed in South African hyrax middens, Geology, 39, 19–22, https://doi.org/10.1130/G31129.1, 2011. a
Chase, B. M., Boom, A., Carr, A. S., Carré, M., Chevalier, M., Meadows, M. E., Pedro, J. B., Stager, J. C., and Reimer, P. J.: Evolving southwest African response to abrupt deglacial North Atlantic climate change events, Quaternary Sci. Rev., 121, 132–136, https://doi.org/10.1016/j.quascirev.2015.05.023, 2015. a
Chase, B. M., Chevalier, M., Boom, A., and Carr, A. S.: The dynamic relationship between temperate and tropical circulation systems across South Africa since the last glacial maximum, Quaternary Sci. Rev., 174, 54–62, https://doi.org/10.1016/j.quascirev.2017.08.011, 2017. a
Chase, B. M., Boom, A., Carr, A. S., Chevalier, M., Quick, L. J., Verboom, G. A., and Reimer, P. J.: Extreme hydroclimate response gradients within the western Cape Floristic region of South Africa since the Last Glacial Maximum, Quaternary Sci. Rev., 219, 297–307, https://doi.org/10.1016/j.quascirev.2019.07.006, 2019. a, b, c, d
Compton, J. S.: The rocks and mountains of Cape Town, Double Storey Books, ISBN 9781919930701, 2004. a
Conradie, S., Hewitson, B., and Wolski, P.: Python code to analyse the association between rainfall data and synoptic wind direction, ZivaHub [code], https://doi.org/10.25375/UCT.16546008.V1, 2021. a
Conradie, S., Hewitson, B., and Wolski, P.: Rainfall quality control and gap-filling procedure using Generalised Additive Models for Location, Scale and Shape (GAMLSS), Ziva Hub [code], https://doi.org/10.25375/uct.18856337, 2022a. a
Conradie, W. S., Wolski, P., and Hewitson, B. C.: Spatial heterogeneity of 2015–2017 drought intensity in South Africa's winter rainfall zone, Adv. Stat. Clim. Meteorol. Oceanogr., 8, 63–81, https://doi.org/10.5194/ascmo-8-63-2022, 2022b. a, b
Conradie, W. S., Slabbert, P. C., Wolski, P., and Hewitson, B. C.: A new frontal identification methodology applied to the South Atlantic Ocean, in preparation, 2022c. a
Cowling, R. M. and Lombard, A. T.: Heterogeneity, speciation/extinction history and climate: Explaining regional plant diversity patterns in the Cape Floristic Region, Divers. Distrib., 8, 163–179, https://doi.org/10.1046/j.1472-4642.2002.00143.x, 2002. a
Cowling, R. M., Esler, K. J., and Rundel, P. W.: Namaqualand, South Africa – An overview of a unique winter-rainfall desert ecosystem, Plant Ecol., 142, 3–21, https://doi.org/10.1023/A:1009831308074, 1999. a, b, c
Cowling, R. M., Ojeda, F., Lamont, B. B., Rundel, P. W., and Lechmere-Oertel, R.: Rainfall reliability, a neglected factor in explaining convergence and divergence of plant traits in fire-prone mediterranean-climate ecosystems, Global Ecol. Biogeogr., 14, 509–519, https://doi.org/10.1111/j.1466-822X.2005.00166.x, 2005. a, b
Cowling, R. M., Procheş, Ş., and Partridge, T. C.: Explaining the uniqueness of the Cape flora: Incorporating geomorphic evolution as a factor for explaining its diversification, Molec. Phylogen. Evol., 51, 64–74, https://doi.org/10.1016/j.ympev.2008.05.034, 2009. a
Cowling, R. M., Bradshaw, P. L., Colville, J. F., and Forest, F.: Levyns' Law: explaining the evolution of a remarkable longitudinal gradient in Cape plant diversity, T. Roy. Soc. S. Afr., 72, 184–201, https://doi.org/10.1080/0035919X.2016.1274277, 2017. a
Deacon, H. J., Jury, M. R., and Ellis, F.: Selective regime and time, in: The ecology of Fynbos: nutrients, fire and diversity, Oxford University Press, Cape Town, 6–22, 1992. a, b
de Buys, A.: Dwarsberg weather station (1214 m), event rainfall, 03/2013–09/2019, SAEON [data set], https://doi.org/10.15493/SAEON.FYNBOS.10000008, 2019. a
Dee, D. P., Uppala, S. M., Simmons, A. J., Berrisford, P., Poli, P., Kobayashi, S., Andrae, U., Balmaseda, M. A., Balsamo, G., Bauer, P., Bechtold, P., Beljaars, A. C. M., van de Berg, L., Bidlot, J., Bormann, N., Delsol, C., Dragani, R., Fuentes, M., Geer, A. J., Haimberger, L., Healy, S. B., Hersbach, H., Hólm, E. V., Isaksen, L., Kållberg, P., Köhler, M., Matricardi, M., McNally, A. P., Monge-Sanz, B. M., Morcrette, J.-J., Park, B.-K., Peubey, C., de Rosnay, P., Tavolato, C., Thépaut, J.-N., and Vitart, F.: The ERA-Interim reanalysis: configuration and performance of the data assimilation system, Q. J. Roy. Meteor. Soc., 137, 553–597, https://doi.org/10.1002/qj.828, 2011. a
Deitch, M., Sapundjieff, M., and Feirer, S.: Characterizing Precipitation Variability and Trends in the World's Mediterranean-Climate Areas, Water, 9, 259, https://doi.org/10.3390/w9040259, 2017. a, b
Dent, M., Lynch, S., and Schulze, R.: Mapping mean annual and other rainfall statistics over southern Africa, Tech. Rep. 109/1/89, Water Research Commission, ISBN 0-947447-16-4, 1987. a
Desmet, P. G.: Namaqualand-A brief overview of the physical and floristic environment, J. Arid Environ., 70, 570–587, https://doi.org/10.1016/j.jaridenv.2006.11.019, 2007. a, b
Desmet, P. G. and Cowling, R. M.: The climate of the Karoo: a functional approach, in: The Karoo, Cambridge University Press, 3–16, https://doi.org/10.1017/CBO9780511541988.004, 1999. a, b, c, d
Dieppois, B., Pohl, B., Rouault, M., New, M., Lawler, D., and Keenlyside, N. S.: Interannual to interdecadal variability of winter and summer southern African rainfall, and their teleconnections, J. Geophys. Res.-Atmos., 121, 6215–6239, https://doi.org/10.1016/j.egypro.2016.11.209, 2016. a, b
Du Plessis, J. and Schloms, B.: An investigation into the evidence of seasonal rainfall pattern shifts in the Western Cape, South Africa, J. S. Afr. Inst. Civ. Eng., 59, 47–55, https://doi.org/10.17159/2309-8775/2017/v59n4a5, 2017. a
DWS – South African National Department of Water Affairs and Sanitation: Drainage Regions Station Catalogue, https://www.dws.gov.za/Hydrology/Verified/hymain.aspx, last access: 7 August 2020. a
Engelbrecht, C. J. and Landman, W. A.: Interannual variability of seasonal rainfall over the Cape south coast of South Africa and synoptic type association, Clim. Dynam., 47, 295–313, https://doi.org/10.1007/s00382-015-2836-2, 2016. a, b
Engelbrecht, C. J., Landman, W. A., Engelbrecht, F. A., and Malherbe, J.: A synoptic decomposition of rainfall over the Cape south coast of South Africa, Clim. Dynam., 44, 2589–2607, https://doi.org/10.1007/s00382-014-2230-5, 2015. a, b, c, d
Engelbrecht, F. A., Marean, C. W., Cowling, R. M., Engelbrecht, C. J., Neumann, F. H., Scott, L., Nkoana, R., O'Neal, D., Fisher, E., Shook, E., Franklin, J., Thatcher, M., McGregor, J. L., Van der Merwe, J., Dedekind, Z., and Difford, M.: Downscaling Last Glacial Maximum climate over southern Africa, Quaternary Sci. Rev., 226, 105879, https://doi.org/10.1016/J.QUASCIREV.2019.105879, 2019. a, b, c
Faith, J. T., Chase, B. M., and Avery, D. M.: Late Quaternary micromammals and the precipitation history of the southern Cape, South Africa, Quaternary Res., 91, 848–860, https://doi.org/10.1017/qua.2018.105, 2019. a
Favre, A., Hewitson, B. C., Lennard, C., Cerezo-Mota, R., and Tadross, M.: Cut-off Lows in the South Africa region and their contribution to precipitation, Clim. Dynam., 41, 2331–2351, https://doi.org/10.1007/s00382-012-1579-6, 2013. a, b, c, d
Fick, S. E. and Hijmans, R. J.: WorldClim 2: new 1 km spatial resolution climate surfaces for global land areas, Int. J. Climatol., 37, 4302–4315, https://doi.org/10.1002/joc.5086, 2017. a
Goldblatt, P. and Manning, J. C.: Plant Diversity of the Cape Region of Southern Africa, Ann. Mo. Bot. Gard., 89, 281, https://doi.org/10.2307/3298566, 2002. a
Granger, R., Meadows, M. E., Hahn, A., Zabel, M., Stuut, J.-B. W., Herrmann, N., and Schefuß, E.: Late-Holocene dynamics of sea-surface temperature and terrestrial hydrology in southwestern Africa, Holocene, 28, 695–705, https://doi.org/10.1177/0959683617744259, 2018. a
Helme, N. and Schmiedel, U.: Namaqualand nightmare, Veld and Flora, 14–19, https://botanicalsociety.org.za/d043-veld-flora-june-2020-issue/ (last access: 3 March 2022), 2020. a
Hersbach, H., Bell, B., Berrisford, P., Biavati, G., Horányi, A., Muñoz Sabater, J., Nicolas, J., Peubey, C., Radu, R., Rozum, I., Schepers, D., Simmons, A., Soci, C., Dee, D., and Thépaut, J.-N.: ERA5 hourly data on single levels from 1979 to present, Copernicus Climate Change Service (C3S) Climate Data Store (CDS) [data set], https://doi.org/10.24381/cds.adbb2d47, 2018 a
Hersbach, H., Bell, B., Berrisford, P., Hirahara, S., Horányi, A., Muñoz-Sabater, J., Nicolas, J., Peubey, C., Radu, R., Schepers, D., Simmons, A., Soci, C., Abdalla, S., Abellan, X., Balsamo, G., Bechtold, P., Biavati, G., Bidlot, J., Bonavita, M., De Chiara, G., Dahlgren, P., Dee, D., Diamantakis, M., Dragani, R., Flemming, J., Forbes, R., Fuentes, M., Geer, A., Haimberger, L., Healy, S., Hogan, R. J., Hólm, E., Janisková, M., Keeley, S., Laloyaux, P., Lopez, P., Lupu, C., Radnoti, G., de Rosnay, P., Rozum, I., Vamborg, F., Villaume, S., and Thépaut, J.-N. N.: The ERA5 global reanalysis, Q. J. Roy. Meteorol. Soc., 146, 1999–2049, https://doi.org/10.1002/qj.3803, 2020. a
Hijmans, R. J., Cameron, S. E., Parra, J. L., Jones, P. G., and Jarvis, A.: Very high resolution interpolated climate surfaces for global land areas, Int. J. Climatol., 25, 1965–1978, https://doi.org/10.1002/joc.1276, 2005. a
Hoffman, M. T., Carrick, P. J., Gillson, L., and West, A. G.: Drought, climate change and vegetation response in the succulent karoo, South Africa, S. Afr. J. Sci., 105, 54–60, https://doi.org/10.1590/S0038-23532009000100021, 2009. a
Hofmeyr, W. L.: Só lyk die weer, Tafelberg, Cape Town, ISBN 0 624 02117 3, 1984. a, b
Hoyer, S. and Hamman, J. J.: xarray: N-D labeled Arrays and Datasets in Python, Journal of Open Research Software, 5, 10, https://doi.org/10.5334/jors.148, 2017. a
Hoyer, S., Fitzgerald, C., Hamman, J., akleeman, Kluyver, T., Roos, M., Helmus, J. J., Markel, Cable, P., Maussion, F., Miles, A., Kanmae, T., Wolfram, P., Sinclair, S., Bovy, B., ebrevdo, Guedes, R., Abernathey, R., Spencer Hill, F., Richards, N., Lee, A., Koldunov, N., Graham, M., maciekswat, Gerard, J., Babuschkin, I., Deil, C., Welch, E., and Hilboll, A.: xarray: v0.8.0, Zenodo [code], https://doi.org/10.5281/zenodo.59499, 2016. a
Kam, J., Min, S.-K., Wolski, P., and Kug, J.-S.: CMIP6 Model-Based Assessment of Anthropogenic Influence on the Long Sustained Western Cape Drought over 2015–19, B. Am. Meteorol. Soc., 102, S45–S50, https://doi.org/10.1175/BAMS-D-20-0159.1, 2021. a
Kloppers, P.-L.: Investigating the relationships between wheat-specific rainfall characteristics, large-scale modes of climate variability and wheat yields in the Swartland region, South Africa, MS thesis, University of Cape Town, http://hdl.handle.net/11427/13214 (last access: 3 March 2022), 2014. a
Lakhraj-Govender, R., Grab, S. W., and Beukes Yali Woyessa, N.: Rainfall and river flow trends for the Western Cape Province, South Africa, S. Afr. J. Sci., 115, 1–6, https://doi.org/10.17159/sajs.2019/6028, 2019. a
Liebmann, B., Bladé, I., Kiladis, G. N., Carvalho, L. M., Senay, G. B., Allured, D., Leroux, S., and Funk, C.: Seasonality of African precipitation from 1996 to 2009, J. Climate, 25, 4304–4322, https://doi.org/10.1175/JCLI-D-11-00157.1, 2012. a
Lynch, S. D.: Development of a raster database of annual, monthly and daily rainfall for Southern Africa: Report to the water research commission, Tech. Rep., WRC Report 1156/1/04, Water Research Commission, Pretoria, South Africa, ISBN 1-77005-250-X, 2004. a, b, c, d, e
MacKellar, N., Hewitson, B. C., and Tadross, M. A.: Namaqualand's climate: Recent historical changes and future scenarios, J. Arid Environ., 70, 604–614, https://doi.org/10.1016/j.jaridenv.2006.03.024, 2007. a
MacPherson, A. J. A., Gillson, L., and Hoffman, M. T.: Climatic buffering and anthropogenic degradation of a Mediterranean-type shrubland refugium at its semi-arid boundary, South Africa, Holocene, 28, 651–666, https://doi.org/10.1177/0959683617735582, 2018. a, b
Mahlalela, P. T., Blamey, R. C., and Reason, C. J. C.: Mechanisms behind early winter rainfall variability in the southwestern Cape, South Africa, Clim. Dynam., 53, 21–39, https://doi.org/10.1007/s00382-018-4571-y, 2019. a, b, c
Masante, D., McCormick, N., Vogt, J., Carmona-Moreno, C., Cordano, E., and Ameztoy, I.: 2018 Drought and Water Crisis in Southern Africa, Tech. rep., European Commission, Ispra, https://doi.org/10.2760/81873, 2018. a
Mbali, S.: Improving estimation of precipitation and prediction of river flows in the Jonkershoek mountain catchment, PhD thesis, University of the Western Cape, http://etd.uwc.ac.za/handle/11394/2760 (last access: 6 March 2022), 2016. a
Mbokodo, I., Bopape, M.-J. M., Chikoore, H., Engelbrecht, F. A., and Nethengwe, N.: Heatwaves in the Future Warmer Climate of South Africa, Atmosphere, 11, 712, https://doi.org/10.3390/atmos11070712, 2020. a
Met Office: Cartopy: a cartographic python library with a matplotlib interface, Exeter, Devon, http://scitools.org.uk/cartopy (last access: 6 March 2022), 2010–2020. a
Meyer-Christoffer, A., Becker, A., Finger, P., Schneider, U., and Ziese, M.: GPCC Climatology Version 2018 at 0.25∘: Monthly Land-Surface Precipitation Climatology for Every Month and the Total Year from Rain-Gauges built on GTS-based and Historical Data, DWD [data set], https://doi.org/10.5676/DWD_GPCC/CLIM_M_V2018_025, 2018. a, b
Moses, G.: The establishment of the long-term rainfall trends in the annual rainfall patterns in the Jonkershoek Valley, Western Cape, South Africa, Master's thesis, University of the Western Cape, http://etd.uwc.ac.za/xmlui/handle/11394/2760 (last access: 3 March 2022), 2008. a
Myers, N., Mittermeler, R. A., Mittermeler, C. G., Da Fonseca, G. A., and Kent, J.: Biodiversity hotspots for conservation priorities, Nature, 403, 853–858, https://doi.org/10.1038/35002501, 2000. a
Naik, M. and Abiodun, B. J.: Projected changes in drought characteristics over the Western Cape, South Africa, Meteorol. Appl., 27, e1802, https://doi.org/10.1002/met.1802, 2019. a
Ndebele, N. E., Grab, S., and Turasie, A.: Characterizing rainfall in the south-western Cape, South Africa: 1841–2016, Int. J. Climatol., 40, joc.6314, https://doi.org/10.1002/joc.6314, 2019. a, b
Nicholson, S. E.: The nature of rainfall variability over Africa on time scales of decades to millenia, Global Planet. Change, 26, 137–158, https://doi.org/10.1016/S0921-8181(00)00040-0, 2000. a
Pascale, S., Kapnick, S. B., Delworth, T. L., and Cooke, W. F.: Increasing risk of another Cape Town “Day Zero” drought in the 21st century, P. Natl. Acad. Sci. USA, 117, 202009144, https://doi.org/10.1073/pnas.2009144117, 2020. a
Pedregosa, F., Varoquaux, G., Gramfort, A., Michel, V., Thirion, B., Grisel, O., Blondel, M., Prettenhofer, P., Weiss, R., Dubourg, V., Vanderplas, J., Passos, A., Cournapeau, D., Brucher, M., Perrot, M., and Duchesnay, E.: Scikit-learn: Machine Learning in Python, J. Mach. Learn. Res., 12, 2825–2830, 2011. a
Pegram, G. and Bárdossy, A.: Downscaling Regional Circulation Model rainfall to gauge sites using recorrelation and circulation pattern dependent quantile–quantile transforms for quantifying climate change, J. Hydrol., 504, 142–159, https://doi.org/10.1016/J.JHYDROL.2013.09.014, 2013. a
Philippon, N., Rouault, M., Richard, Y., and Favre, A.: The influence of ENSO on winter rainfall in South Africa, Int. J. Climatol., 32, 2333–2347, https://doi.org/10.1002/joc.3403, 2012. a, b, c
Polade, S. D., Gershunov, A., Cayan, D. R., Dettinger, M. D., and Pierce, D. W.: Precipitation in a warming world: Assessing projected hydro-climate changes in California and other Mediterranean climate regions, Sci. Rep., 7, 1–10, https://doi.org/10.1038/s41598-017-11285-y, 2017. a
Procheş, C., Cowling, R. M., and Du Preez, D. R.: Patterns of geophyte diversity and storage organ size in the winter-rainfall region of southern Africa, Divers. Distrib., 11, 101–109, https://doi.org/10.1111/j.1366-9516.2005.00132.x, 2005. a, b, c
Quick, L. J., Meadows, M. E., Bateman, M. D., Kirsten, K. L., Mäusbacher, R., Haberzettl, T., and Chase, B. M.: Vegetation and climate dynamics during the last glacial period in the fynbos-afrotemperate forest ecotone, southern Cape, South Africa, Quaternary Int., 404, 136–149, https://doi.org/10.1016/J.QUAINT.2015.08.027, 2016. a
R Core Team: R 3.4.6: A Language and Environment for Statistical Computing, R Foundation for Statistical Computing, Vienna, Austria, https://www.R-project.org/ (last access: 6 March 2022), 2018. a
Reason, C. J. C.: Climate of Southern Africa, in: Oxford Research Encyclopedia of Climate Science, Oxford University Press, https://doi.org/10.1093/acrefore/9780190228620.013.513, 2017. a, b, c
Reason, C. J. C. and Rouault, M.: Links between the Antarctic Oscillation and winter rainfall over western South Africa, Geophys. Res. Lett., 32, 1–4, https://doi.org/10.1029/2005GL022419, 2005. a
Rebelo, A. G., Boucher, C., Helme, N., Mucina, L., Rutherford, M. C., Smit, W. J., Powrie, L. W., Ellis, F., Lambrechts, J. J. N., Scott, L., Radloff, F. G. T., Johnson, S. D., Richardson, D. M., Ward, R. A., Procheš, Š. M., Oliver, E. G. H., Manning, J. C., Jürgens, N., McDonald, D. J., Janssen, J. A. M., Walton, B. A., le Roux, A., Skowno, A. L., Todd, S. W., and Hoare, D. B.: Fynbos Biome, in: The vegetation of South Africa, Lesotho and Swaziland, 52–219, ISBN 10 1-919976-21-3, ISBN 13 978-1-919976-21-1, 2006. a, b, c
Rigby, R. A. and Stasinopoulos, D. M.: Generalized additive models for location, scale and shape, J. Roy. Stat. Soc. C-Appl., 54, 507–554, https://doi.org/10.1111/J.1467-9876.2005.00510.X, 2005. a, b
Roffe, S. J., Fitchett, J. M., and Curtis, C. J.: Classifying and mapping rainfall seasonality in South Africa: a review, S. Afr. Geogr. J., 101, 158–174, https://doi.org/10.1080/03736245.2019.1573151, 2019. a, b, c
Roffe, S. J., Fitchett, J. M., and Curtis, C. J.: Determining the utility of a percentile-based wet-season start- and end-date metrics across South Africa, Theor. Appl. Climatol., 140, 1331–1347, https://doi.org/10.1007/s00704-020-03162-y, 2020. a, b
Roffe, S. J., Fitchett, J. M., and Curtis, C. J.: Investigating changes in rainfall seasonality across South Africa: 1987–2016, Int. J. Climatol., 41, E2031–E2050, https://doi.org/10.1002/joc.6830, 2021a. a
Roffe, S. J., Fitchett, J. M., and Curtis, C. J.: Quantifying rainfall seasonality across South Africa on the basis of the relationship between rainfall and temperature, Clim. Dynam., 56, 2431–2450, https://doi.org/10.1007/s00382-020-05597-5, 2021b. a, b, c, d, e
Rudeva, I., Simmonds, I., Crock, D., and Boschat, G.: Midlatitude fronts and variability in the Southern Hemisphere tropical width, J. Climate, 32, JCLI-D-18-0782.1, https://doi.org/10.1175/jcli-d-18-0782.1, 2019. a
Schneider, U., Finger, P., Meyer-Christoffer, A., Rustemeier, E., Ziese, M., and Becker, A.: Evaluating the Hydrological Cycle over Land Using the Newly-Corrected Precipitation Climatology from the Global Precipitation Climatology Centre (GPCC), Atmosphere, 8, 52, https://doi.org/10.3390/atmos8030052, 2017. a
Schneider, U., Becker, A., Finger, P., Meyer-Christoffer, A., and Ziese, M.: GPCC Full Data Monthly Version 2018.0 at 0.25∘: Monthly Land-Surface Precipitation from Rain-Gauges built on GTS-based and Historic Data, DWD [data set], https://doi.org/10.5676/DWD_GPCC/FD_M_V2018_025, 2018. a
Schoenach, D., Simon, T., and Mayr, G. J.: Postprocessing ensemble forecasts of vertical temperature profiles, Adv. Stat. Clim. Meteorol. Oceanogr., 6, 45–60, https://doi.org/10.5194/ascmo-6-45-2020, 2020. a
Schulze, R. E. and Maharaj, M.: Rainfall Seasonality, in: South African Atlas of Climatology and Agrohydrology, edited by: Schulze, R. E., WRC Report 1489/1/06, Sect. 6.5, Water Research Commission, Pretoria, South Africa, 2007. a, b, c
Schulzweida, U.: CDO User Guide, Zenodo, https://doi.org/10.5281/zenodo.3539275, 2019. a
Schumann, T. E. W. and Hofmeyr, W. L.: The partition of a region into rainfall districts: With special reference to South Africa, Q. J. Roy. Meteorol. Soc., 64, 482–488, https://doi.org/10.1002/qj.49706427612, 1938. a, b, c, d
Schwarz, G.: Estimating the Dimension of a Model, Ann. Stat., 6, 461–464, https://doi.org/10.1214/aos/1176344136, 1978. a
Seager, R., Osborn, T. J., Kushnir, Y., Simpson, I. R., Nakamura, J., and Liu, H.: Climate variability and change of mediterranean-type climates, J. Climate, 32, 2887–2915, https://doi.org/10.1175/JCLI-D-18-0472.1, 2019. a
Sinclair-Smith, K. and Winter, K.: Water demand management in Cape Town: managing water security in a changing climate, Mainstreaming Climate Change in Urban Development: lessons from Cape Town, 100–133, https://www.researchgate.net/publication/325626526_Water_demand_management_in_Cape_Town (last access: 3 March 2022), 2019. a, b
Slingsby, J. A., Buys, A., Simmers, A. D. A., Prinsloo, E., Forsyth, G. G., Glenday, J., and Allsopp, N.: Jonkershoek: Africa's oldest catchment experiment – 80 years and counting, Hydrol. Process., 35, e14101, https://doi.org/10.1002/hyp.14101, 2021. a, b, c
Smithers, J. and Schulze, R.: Long duration design rainfall estimates for South Africa, Water Research Commission Pretoria, http://www.wrc.org.za/wp-content/uploads/mdocs/811-1-00.pdf (last access: 7 March 2022), 2000. a, b
Sousa, P. M., Blamey, R., Reason, C., Ramos, A. M., and Trigo, R. M.: The “Day Zero” Cape Town drought and the poleward migration of moisture corridors, Environ. Res. Lett., 13, 124025, https://doi.org/10.1088/1748-9326/aaebc7, 2018. a, b, c
South African Forestry Research Institute (SAFRI) and Council for Scientific and Industrial Research (CSIR): 17B manual monthly rainfall February 1945–September 1991, https://doi.org/10.15493/SAEON.FYNBOS.17B4591, 2020a. a
South African Forestry Research Institute (SAFRI) and Council for Scientific and Industrial Research (CSIR): 18B manual monthly rainfall February 1945–September 1991, https://doi.org/10.15493/SAEON.FYNBOS.18B4591, 2020b. a
Stager, J. C., Mayewski, P. A., White, J., Chase, B. M., Neumann, F. H., Meadows, M. E., King, C. D., and Dixon, D. A.: Precipitation variability in the winter rainfall zone of South Africa during the last 1400 yr linked to the austral westerlies, Clim. Past, 8, 877–887, https://doi.org/10.5194/cp-8-877-2012, 2012. a
Stasinopoulos, D. M. and Rigby, R. A.: Generalized additive models for location scale and shape (GAMLSS) in R, J. Stat. Softw., 23, 1–46, https://doi.org/10.18637/jss.v023.i07, 2007. a
Statistics South Africa: Mid-year population estimates 2020: P0302, Tech. Rep. July, Statistics South Africa, https://www.statssa.gov.za, last access: 16 November 2020. a
Sun, X., Cook, K. H., Vizy, E. K., Sun, X., Cook, K. H., and Vizy, E. K.: The South Atlantic subtropical high: Climatology and interannual variability, J. Climate, 30, 3279–3296, https://doi.org/10.1175/JCLI-D-16-0705.1, 2017. a
Theron, S., Archer, E. R. M., Midgley, S., and Walker, S.: Agricultural perspectives on the 2015–2018 Western Cape drought, South Africa: Characteristics and spatial variability in the core wheat growing regions, Agr. Forest Meteorol., 304–305, 108405, https://doi.org/10.1016/j.agrformet.2021.108405, 2021. a
Trigo, R. M. and DaCamara, C. C.: Circulation weather types y their influence on the precipitation regime in Portugal, Int. J. Climatol., 20, 1559–1581, https://doi.org/10.1002/1097-0088(20001115)20:13<1559::AID-JOC555>3.0.CO;2-5, 2000. a, b
Tyson, P. D.: Atmospheric circulation changes and palaeoclimates of southern Africa, S. Afr. J. Sci., 95, 194–201, https://hdl.handle.net/10520/AJA00382353_8248 (last access: 7 March 2022), 1999. a
Van Niekerk, A. and Joubert, S. J.: Input variable selection for interpolating high-resolution climate surfaces for the Western Cape, Water SA, 37, 271–280, https://doi.org/10.4314/wsa.v37i3.68475, 2011. a, b
van Oldenborgh, G. J., Drijfhout, S., van Ulden, A., Haarsma, R., Sterl, A., Severijns, C., Hazeleger, W., and Dijkstra, H.: Western Europe is warming much faster than expected, Clim. Past, 5, 1–12, https://doi.org/10.5194/cp-5-1-2009, 2009. a
van Rooy, M. P.: Influence of berg winds on the temperatures along the west coast of South Africa, Q. J. Roy. Meteorol. Soc., 62, 528–537, https://doi.org/10.1002/qj.49706226707, 1936. a
Veitch, J. A. and Penven, P.: The role of the Agulhas in the Benguela Current system: A numerical modeling approach, J. Geophys. Res.-Oceans, 122, 3375–3393, https://doi.org/10.1002/2016JC012247, 2017. a
von Storch, H. and Zwiers, F. W.: Statistical Analysis in Climate Research, Cambridge University Press, Cambridge, UK, ISBN 0-521-01230-9, 1999. a, b, c
Ward, J. H.: Hierarchical Grouping to Optimize an Objective Function, J. Am. Stat. Assoc., 58, 236–244, https://doi.org/10.1080/01621459.1963.10500845, 1963. a
Wicht, C. L.: A preliminary account of rainfall in jonkershoek, T. Roy. Soc. S. Afr., 28, 161–173, https://doi.org/10.1080/00359194009520010, 1940. a
Wickham, H.: ggplot2: Elegant Graphics for Data Analysis, Use R!, Springer, https://doi.org/10.1007/978-0-387-98141-3, 2009. a
Wickham, H., Averick, M., Bryan, J., Chang, W., McGowan, L., François, R., Grolemund, G., Hayes, A., Henry, L., Hester, J., Kuhn, M., Pedersen, T., Miller, E., Bache, S., Müller, K., Ooms, J., Robinson, D., Seidel, D., Spinu, V., Takahashi, K., Vaughan, D., Wilke, C., Woo, K., and Yutani, H.: Welcome to the Tidyverse, Journal of Open Source Software, 4, 1686, https://doi.org/10.21105/joss.01686, 2019. a
Wolski, P., Conradie, S., Jack, C., and Tadross, M.: Spatio-temporal patterns of rainfall trends and the 2015–2017 drought over the winter rainfall region of South Africa, Int. J. Climatol., 41, E1303–1319, joc.6768, https://doi.org/10.1002/joc.6768, 2021. a, b, c, d, e, f, g, h, i, j, k, l, m, n, o, p
Wong, B.: Color blindness, Nat. Meth., 8, 441, https://doi.org/10.1038/nmeth.1618, 2011. a
- Abstract
- Introduction
- Physical geography of the WRZ
- Methodology
- Results
- New framework for South-Western Southern African WRZ seasonality structure
- Discussion
- Conclusions
- Appendix A: Additional methodological details
- Code and data availability
- Author contributions
- Competing interests
- Disclaimer
- Acknowledgements
- Financial support
- Review statement
- References