the Creative Commons Attribution 4.0 License.
the Creative Commons Attribution 4.0 License.
Spatial trend analysis of gridded temperature data at varying spatial scales
Thordis L. Thorarinsdottir
Sigrunn H. Sørbye
Christian L. E. Franzke
Classical assessments of trends in gridded temperature data perform independent evaluations across the grid, thus, ignoring spatial correlations in the trend estimates. In particular, this affects assessments of trend significance as evaluation of the collective significance of individual tests is commonly neglected. In this article we build a space–time hierarchical Bayesian model for temperature anomalies where the trend coefficient is modelled by a latent Gaussian random field. This enables us to calculate simultaneous credible regions for joint significance assessments. In a case study, we assess summer season trends in 65 years of gridded temperature data over Europe. We find that while spatial smoothing generally results in larger regions where the null hypothesis of no trend is rejected, this is not the case for all subregions.
- Article
(6448 KB) - Full-text XML
- BibTeX
- EndNote
Analyses of temperature data in space and time play a crucial role in the study of climate change. Quantifying temperature trends globally and regionally is still part of the global warming debate and challenges policymakers and stakeholders in their efforts to postulate adequate adaptation and mitigation initiatives. In particular, sound and robust decision making calls for extending point estimates by also specifying their uncertainty (Thorarinsdottir et al., 2017). Most assessments of changes in historical climate are performed by assessing trends in time series of observational data or observation-based data products (see e.g. the most recent assessment report of the Intergovernmental Panel on Climate Change – IPCC; Stocker et al., 2013). The trend modelling is commonly performed by estimating the linear component of the change over time even if this simple approach has many well-known shortcomings. Trends in the large-scale state of the climate system may reflect systematic changes or low-frequency internal variability of the system, particularly for short time series (von Storch and Zwiers, 1999). Longer time series may include breakpoints which change the nature of the trend (Seidel and Lanzante, 2004). Aiming for a more general approach to trend estimation, Wu et al. (2007) define the trend as a monotonic function and suggest to estimate the trend by decomposing the data into so-called intrinsic mode functions in a non-parametric manner where the trend component is the residual (see also Franzke, 2014). Similarly, Craigmile and Guttorp (2011) build a wavelet-based hierarchical Bayesian model to estimate both seasonality and trend, while Scinocca et al. (2010) estimate a non-linear trend using smoothing splines.
The trend assessment additionally requires an appropriate modelling of the serial correlation in the data (von Storch and Zwiers, 1999; Chandler and Scott, 2011). In the most recent assessment of atmospheric and surface observations, the IPCC chose to employ a linear trend model with a first-order autoregressive, or AR(1), error structure following Santer et al. (2008) “because it can be applied consistently to all the data sets, is relatively simple, transparent and easily comprehended, and is frequently used in the published research assessed” (Hartmann et al., 2013a, pp. 180). A comparison of various analysis methods for global mean annual temperature series revealed that allowing AR(1) dependence in the data yields confidence intervals for the trend estimates that are roughly twice the width of those obtained under assumptions of independence (Hartmann et al., 2013b). Alternative approaches to model the temporal correlation include long-term memory models (e.g. Bunde et al., 2014; Craigmile and Guttorp, 2011; Franzke, 2010, 2012; Ludescher et al., 2015) which are more appropriate for data with natural low-frequency variability (Lorenz, 1976).
A standard approach in climatology is to work with gridded data products (e.g. New et al., 2000). For gridded data and multi-site analyses, the trend modelling and the subsequent testing of trend significance are usually performed independently in each grid point location (Hartmann et al., 2013a), with a few exceptions (e.g. Craigmile and Guttorp, 2011). Livezey and Chen (1983) and later Wilks (2006, 2016) rightfully argue that collections of multiple statistical tests, such as individual tests at many spatial grid points, are often interpreted incorrectly and in a way that overstates research results. Wilks (2006, 2016) suggests controlling the false discovery rate (FDR) (Benjamini and Hochberg, 1995) to deal with this problem. We propose to take this a step further and perform a joint spatial analysis and construct simultaneous credible regions to assess the significance of the trend estimates jointly in space.
We employ the same basic trend assessment model as the IPCC uses in its most recent assessment report (Hartmann et al., 2013a). That is, we apply a Gaussian model with a linear trend and an AR(1) temporal correlation structure. Additionally, we assume a spatial structure in the trend coefficient and add a spatial error term. Parameter estimation is obtained using Bayesian methodology, combining the stochastic partial differential equation (SPDE) approach of Lindgren et al. (2011) with the methodology of integrated nested Laplace approximation (INLA) (Rue et al., 2009). Based on the posterior distribution of the spatial trend coefficient, we then perform a simultaneous assessment over the spatial domain following Bolin and Lindgren (2015). We compare the joint assessment to independent assessments in each grid point location based on the marginal posterior distributions. In a case study, we apply our approach to a gridded data product for summer mean temperatures in Europe. There is a consensus that temperatures in Europe are generally warming. However, to which extent depends on the region or spatial scale, the time frame and the data source considered (e.g. Böhm et al., 2001; Craigmile and Guttorp, 2011; Franzke, 2015; Gao and Franzke, 2017; Lorenz and Jacob, 2010; Tietäväinen et al., 2010; van der Schrier et al., 2011, 2013).
The remainder of this paper is organized as follows. The data used in our analysis is described in Sect. 2. The following Sect. 3 provides a description of the model, a review of the Bayesian estimation approach, and a description of the methods for assessing the significance of the trend estimates. The results are provided in Sect. 4, and conclusions are given in Sect. 5.
We analyse the European gridded observation dataset (E-OBS) gridded daily temperature data product version 11.0 for the time period 1 January 1950 through 31 December 2014 (Haylock et al., 2008). E-OBS is a land-only gridded version of the European Climate Assessment (ECA) data set which contains series of daily observations at meteorological stations throughout Europe and the Mediterranean collected by the Royal Netherlands Meteorological Institute (KNMI). The original data product covers the area 25–75∘ N × 40∘ W–75∘ E on a 0.25∘ regular grid. The details of the gridding procedure are given in Haylock et al. (2008) and Hofstra et al. (2008). The gridding involves a three-step approach that includes a data homogenization step. Assessments of uncertainties related to measurements or gridding procedures are not included in E-OBS version 11.0, and we have, thus, not considered these here.
Prior to the statistical analysis, we compute a seasonal mean based on the daily data for the summer season covering June through August (JJA). This results in a time series of length 65 in each grid point. Finally, each time series is mean centred and standardized prior to the analysis, leaving series of local anomalies for investigation of trends on a decadal scale. To investigate the effects of spatial scale on the resulting trend estimates, we consider spatially upscaled versions of the data where the 0.25∘ gridded anomalies have been upscaled to a regular 1∘ grid and a regular 5∘ grid over the entire European domain as well as data on a regular 0.5∘ grid over Fennoscandia and Iberia. The upscaling is performed by averaging up so that, for example, a 1∘ gridded value is given by the average of the corresponding set of 16 values at the 0.25∘ resolution. Ideally we would like to keep the finer scale analysis at the original 0.25∘ resolution, but for computational reasons, full resolution is traded off for spatial extent.
Let {Yst} denote a set of temperatures, in our case standardized seasonal mean temperature anomalies, at spatial locations and time points . The aim of the current study is to assess the spatial extent of potential trends in the data set. For this, we perform a spatial analysis in which both the model estimation and the subsequent significance testing are performed in a spatially coherent manner.
3.1 Linear trend estimation
For a spatial linear trend estimation, we employ a space–time model of the type
where gs(t) describes the trend at location s, while εst denotes Gaussian noise which is uncorrelated in space and time. More explicitly, we assume the following specification for the trend term gs(t),
where and for . That is, the trend gs(t) follows an AR(1) process in time with noise terms that are zero-mean and temporally independent but spatially correlated Gaussian random fields (GRFs). We denote the continuously indexed GRFs by , where for . The model also assumes a spatially correlated GRF denoted for the trend coefficient, again with for i=1, …, n. Here, β0 denotes the overall trend, while the random field β(s) models the deviations from the overall trend across space. We assume that each of the GRFs for the noise and trend coefficients has a stationary Matérn covariance structure (Matérn, 1960). This implies that the covariance between two components of the GRF at spatial locations si and sj is modelled by the covariance function
where Γ is the gamma function, Kν is the modified Bessel function of the second kind, d(si,sj) denotes the Euclidean distance between the locations si and sj, σ2 is the marginal variance parameter, ν controls the smoothness, and κ is a spatial scale parameter.
3.2 Statistical inference using the SPDE–INLA approach
Spatial analyses involving high-dimensional covariance matrices are often not computationally feasible due to the dense structure of such matrices. A computationally efficient alternative in fitting Eqs. (1)–(2) is to make use of the SPDE approach introduced by Lindgren et al. (2011). A key idea of this approach is to construct continuously indexed approximations of GRFs by solving SPDEs. The solution is then represented as a Gaussian Markov random field (GMRF) having a sparse precision (inverse covariance) matrix. The GMRF representation is used for practical computation, and the solution retains a well-defined continuous interpretation.
For illustration, we take a brief look at how the GMRF representation of the trend coefficient field is constructed. The construction for the noise field is obtained in exactly the same manner. For general dimension d let {β(s), s∈ℝd} denote a continuously indexed GRF with Matérn covariance, also referred to as a Matérn field. This field represents an exact and stationary solution to the stochastic partial differential equation
where ∇ is the Laplacian and 𝒲(s) is a Gaussian white noise process. The parameters in the two formulations of Eq. (3) and Eq. (4) are coupled in that the Matérn smoothness equals and the marginal variance is given by
Furthermore, the range of the covariance structure can be described by
the distance for which the correlation function has fallen to approximately 0.13, for all (Lindgren and Rue, 2015). Here, we set α=2, which is the most natural choice for d=2 according to Whittle (1954). Alternative models are discussed in e.g. Lindgren et al. (2011) and Lindgren and Rue (2015).
An approximate solution of Eq. (4) can be found using the finite element method by first defining a triangular mesh with G vertices on the relevant continuous domain and then using the piecewise linear representation.
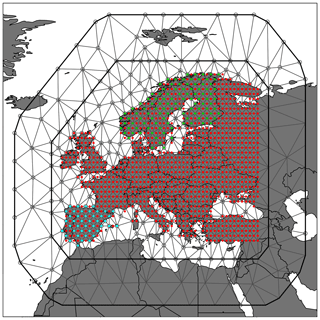
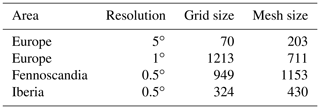
Here, the basis functions {ψg(s)} are chosen to have the value of 1 at vertex g, while being 0 at all other vertices. The weights , giving the heights of the triangles, have a Gaussian distribution with zero mean. The resulting discretely indexed vector for the trend coefficients at the vertices, , will be a GMRF, as the SPDE solutions of Eq. (4) are Markovian when α is integer valued (see Lindgren et al., 2011, for further details). Examples of the triangular mesh used in our analysis are shown in Fig. 1, and a list of the data sets used for the analysis is given in Table 1.
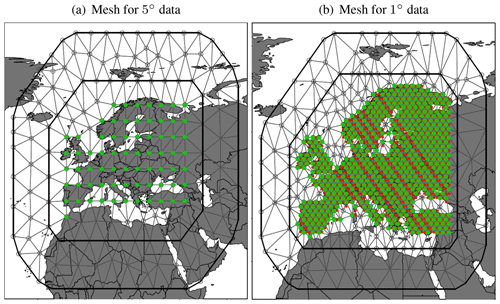
Figure 1The triangular meshes used in our full European domain analyses for data on a 5∘ grid (a) and data on a 1∘ grid (b). Data locations are indicated by red dots; those coinciding with mesh vertices are superimposed in green.
Table 1Overview over the data resolution, the size of the spatial data grid and the mesh size for the four data sets analysed in this study.
A major benefit of the SPDE approach is its implementation within the computational framework of latent Gaussian models using the R package R-INLA (Rue et al., 2009, 2017). In general, latent Gaussian models represent a subclass of structured additive regression models (Fahrmeir and Tutz, 2001) having a three-stage hierarchical structure. First, the observations {Yst} are assumed to be conditionally independent given a latent field x and hyper-parameters θ1. In our case, the likelihood is then specified by
in which we assume a Gaussian distribution for the observations. Second, all random variables in Eq. (2), including the predictor ηst=E(Yst), are incorporated into the latent field . A crucial assumption of latent Gaussian models is that x is a Gaussian Markov random field, i.e.
where the precision matrix Q(θ2) is sparse.
Finally, the third stage specifies a prior for the hyper-parameters, typically being non-Gaussian. In Eq. (2), we have five hyper-parameters, including the first-lag autocorrelation coefficient φ and the parameters τ and κ related to the variance (Eq. 5) and range (Eq. 6) of the Matérn fields. The resulting posterior is then expressed by
where the hyper-parameters are given independent priors. Specifically, we set to ensure that and and for both the trend coefficient field and the noise field. Here, log (τ0) and log (κ0) are determined automatically in the inference procedure depending on properties of the mesh (see Lindgren and Rue, 2015, as well as Figs. 6 and 7 for further details).
The INLA methodology is a deterministic approach that combines numerical approximations, interpolation and integration to provide accurate estimates of the posterior marginals for all components of the latent field and all the hyper-parameters. Implementation is greatly facilitated by the R-INLA package, which in general can be used to fit SPDE models of different complexity and combine these with various latent model components to build the linear predictor (see Blangiardo and Cameletti, 2015, and Krainski et al., 2018, for recent updates to the SPDE–INLA approach).
3.3 Assessing significance of trend estimates
Denoted by Ω⊂ℝ2 is our full study region, that is the union of the n grid cells for which we have data. The uncertainty in the latent trend coefficient process β is commonly assessed using a credible band or an associated p value under a null hypothesis of no trend, separately for each location s∈Ω (Hartmann et al., 2013a). Such a pointwise credible band for β can be defined by the equi-tailed intervals , where qα(si) denotes the α quantile of the posterior marginal distribution of . In our application, it is then of interest to assess for which locations the pointwise credible band does not contain the level u=0.
However, as such pointwise credible bands do not provide a joint interpretation, we also construct a simultaneous credible region so that with probability 1−α, the trend coefficient field β stays inside the credible band at all spatial locations within the region. The simultaneous credible band is defined as the region . Here, ρ is chosen such that the posterior probability . Thus α controls the probability that the trend coefficient field is inside the credible band at all locations in Ω. Similarly as above, we are here interested in the spatial region where u=0 is not contained in the credible band. This region is also called the avoidance excursion set for the level u=0. The simultaneous credible bands and the associated avoidance excursion sets are calculated using the sequential integration method of Bolin and Lindgren (2015), as implemented in the R package excursions (see also Bolin and Lindgren, 2018).
Here, we present and compare the results for the four different data sets described in Table 1. To facilitate readability, we first establish precise terminology for referencing the input data, the intermediate computations, and the results. The E-OBS data are aggregated from their original 0.25∘ resolution, and the input data grid refers to the locations at either of those aggregate levels (5, 1, and 0.5∘). As mentioned in Sect. 3.2, a mesh specifies the triangulation on which the parameter estimation is carried out. Results presented in mesh maps are obtained by rasterizing the meshes to images with pixel resolution reflecting that of the underlying input data. Introducing a common 1×1∘ lattice structure makes it possible to consistently compare maps across different underlying data sets and meshes. Lattice maps are established from projecting mesh fields onto that 1×1∘ structure in space. What distinguishes mesh from lattice maps is that the former is made from simple spatial extrapolation of the field values at the mesh vertices, whereas the latter consists in projecting a continuous, triangulated surface representation of the mesh field directly onto the lattice locations.
4.1 Fennoscandia and Iberia at 0.5∘ resolution
Figure 2 shows the results for data covering Fennoscandia, i.e. Norway, Sweden, and Finland, on a 0.5∘ grid. The posterior mean of the trend estimates are positive overall and range from 0.08 to 0.21 ∘C decade−1 with the highest posterior mean close to Stockholm on Sweden's east coast. The posterior standard deviation is quite constant over the region at around 0.12 ∘C. As a result, the avoidance excursion set where the spatial null hypothesis of no trend is rejected at level α=0.05 consists of a small region around Stockholm only.

Figure 2Trend estimates for Fennoscandia based on input data on a 0.5∘ grid. (a) Posterior mean estimates of the trend coefficient (in ∘C decade−1) projected on a regular 1∘ lattice. (b) Posterior standard deviation of the trend coefficient on the same lattice. (c) Avoidance excursion set where the spatial null hypothesis of no trend is rejected for the level α=0.05 (red). Note that the estimates outside Fennoscandia are based on extrapolation of the data for these three countries.
The posterior mean trend estimates for the Iberian Peninsula in Fig. 3 are somewhat higher than in Fennoscandia and range from 0.12 to 0.29 ∘C decade−1. The lowest values occur in northern Spain, while the highest trends are estimated in northern Portugal and in the Júcar River basin in eastern Spain. The posterior standard deviation of the trend estimates is somewhat lower than in Fennoscandia at approximately 0.10 ∘C decade−1 over the region. The avoidance excursion set for the level α=0.05 now covers slightly less than 50 % of the area, indicating a greater degree of warming compared to Fennoscandia. Note that results for areas outside of the Iberian Peninsula are based on the extrapolation of the data from Iberia and should thus be interpreted with care.

Figure 3Trend estimates for the Iberian Peninsula based on input data on a 0.5∘ grid. (a) Posterior mean estimates of the trend coefficient (in ∘C decade−1) projected on a regular 1∘ lattice. (b) Posterior standard deviation of the trend coefficient on the same lattice. (c) Avoidance excursion set where the spatial null hypothesis of no trend is rejected for the level α=0.05 (red). Note that the estimates outside Iberia are based on data extrapolation.
4.2 Europe at 5 and 1∘ resolutions
Posterior mean estimates of trend coefficient fields for the coarser input data grid resolutions of 5 and 1∘ are shown in Fig. 4. For comparison, we consider results both on rasterizations of the meshes used for the parameter estimation as well as projected onto a regular 1∘ lattice. For the 5∘ data, the posterior mean trend estimates on the lattice range between 0.07 and 0.34 ∘C decade−1, while the range is slightly lower at [−0.05, 0.30] for the higher 1∘ data resolution. At the coarser data resolution the lowest trends are estimated in Romania and Bulgaria in Eastern Europe. When these estimates are extrapolated to the finer-scale lattice, the lowest estimates seem mostly concentrated over Bulgaria. However, for a data resolution of 1∘, the lowest trend estimates concentrate somewhat further north over Romania. Furthermore, we see that the finer-resolution data results in a higher spatial variability in the trend estimates, as one might expect.
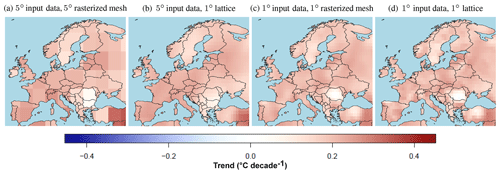
Figure 4Posterior mean estimates of trends (∘C decade−1) in the summer season for 1950–2014 for 5 and 1∘ input data grids resolutions. (a, c) Results on the respective rasterized meshes. (b, d) Results projected onto a common 1∘ lattice.
Several other studies have assessed temperature trends in Europe using a range of methodologies and data sets (see e.g. Hartmann et al., 2013a, and references therein). For studies that use observation-based data sets and consider a similar time period to ours, Tietäväinen et al. (2010) estimate a summer season warming of 0.13 ∘C decade−1 for 1959–2008 in Finland using spatially interpolated station data with a quadratic trend model with a 95 % confidence interval of (−0.08, 0.34). For comparison, our posterior mean estimates across lattice cells that cover Finland have a range of (0.19, 0.21) for the coarser 5∘ data resolution and a range of (0.17, 0.22) for the finer resolution. Estimations from van der Schrier et al. (2011) show a summer warming trend of 0.24 ∘C decade−1 for 1950–2008 in the Netherlands, applying a linear trend model to the Central Netherlands Temperature time series. These estimates are slightly higher than those obtained here, which for the 1∘ lattice cells covering the Netherlands have a range of (0.22, 0.23) when based on 5∘ data and a range of (0.17, 0.21) for 1∘ data. Some of these differences might be due to slightly different time periods considered.
In Fig. 5 we compare a classical significance assessment of the trend estimates, where a test is performed based on the marginal posterior distribution in each lattice cell independently, and assessment based on excursion sets as proposed by Bolin and Lindgren (2015). Note that the spatial test is applied to estimates of continuous trend fields so that the resulting avoidance excursion sets are subsets of continuous fields, while the sets generated by the marginal testing inherit the spatial resolution of the 1∘ lattice.
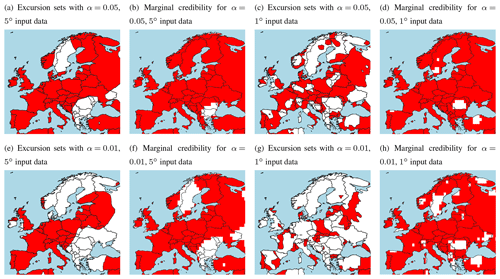
Figure 5Significance assessment of trend estimates with red areas denoting locations where the null hypothesis of no trend is rejected based on avoidance excursion sets for simultaneous credible regions and marginal credible intervals for 5 and 1∘ data. All estimates have been extrapolated to the same 1∘ lattice prior to the significance assessment. The excursion set maps (a, c, e, g) are produced via the continuous() function of the R package excursions, thus reflecting their continuous nature as opposed to the lattice structure kept for the marginal credible intervals (b, d, f, h). The upper panels display results at the 5 % significance level, whereas 1 % significance levels are found in the bottom row.
In the spatial test, the interpretation is that for a large set of realized trend fields, only 5 % of the fields should exhibit no trend anywhere within the avoidance set for α=0.05, and 1 % of the fields should exhibit no trend for α=0.01. This is a much stricter condition than that of assessing the marginal credible intervals. Consequently, the avoidance excursion sets are significantly smaller than the corresponding collection of grid cells where a null hypothesis of no trend is rejected. For example, the avoidance excursion set for a 5∘ data grid and α=0.05 is similar in size and shape than to of the set for the marginal assessment of the same data at α=0.01.
The avoidance excursion sets are widely different for the two data resolutions. At the higher data resolution, the avoidance excursion set has a smaller total area and a more irregular structure. However, the avoidance excursion set for the 1∘ data at a given α level is not a subset of the avoidance excursion set of the coarser data at the same α level (see for instance the area that comprises southern Bulgaria, the eastern part of Greece, and Turkey north of the Sea of Marmara).
For Fennoscandia and the Iberian Peninsula, we see a systematic decline in the size of the avoidance excursion set as the data resolution gets finer. For the 5∘ data, the entire Iberian Peninsula is included in the avoidance excursion set for the level α=0.05 (cf. Fig. 5a), with less than half covered for the finest data resolution of 0.5∘ (cf. Fig. 3c). While the data from Fennoscandia is generally found to exhibit less of a trend, a similar effect of the data resolution is apparent. However, note that for the coarsest data resolution of 5∘ and α=0.05, the area around Stockholm on the east coast of Sweden is not included in the avoidance excursion set (cf. Fig. 5a), while this small region comprises the entire avoidance excursion set at the finest data resolution of 0.5∘ (cf. Fig. 2c). Considering the intermediate data resolution of 1∘ reveals that the Stockholm area is part of the avoidance excursion set at this stage as well (see Fig. 5c). Furthermore, there is an area in the southern part of the Lappland district up north in the country that goes into the avoidance excursion set of the 1∘ resolution data (see again Fig. 5c). Interestingly, this area is included in the avoidance excursion set of neither the coarser 5∘ nor the fine-scale 0.25∘ resolution maps (cf. Fig. 5a and c and Fig. 2c).
4.3 Posterior distributions of hyper-parameters
A further assessment of the difference between the four analyses can be made through a comparison of the respective posterior distributions of the hyper-parameters of the statistical model. The model has five hyper-parameters; the first-lag autocorrelation coefficient and two parameters describe the spatial structure of each of the two latent GRFs. For interpretability, we consider the posterior distributions of the marginal variance (Eq. 5) and the range parameter (Eq. 6) for each GRF rather than those for the model parameters τ and κ.
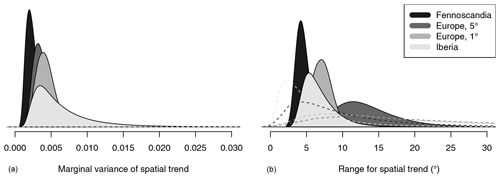
The posterior distributions for the marginal variance and the range parameter for the spatial trend coefficient are given in Fig. 6. Recall that the range parameter is defined as the distance at which the correlation has fallen to approximately 0.13. The posterior mean estimates of the range are 13.4∘ for the 5∘ data, 7.1 for the 1∘ data, 6.7 for the 0.5∘ data in Iberia, and 4.4 for the 0.5∘ data in Fennoscandia. This indicates a substantial correlation between the trend estimates across neighbouring grid cells irrespective of the input data grid resolution, with the neighbourhoods growing in size with finer data resolution. The posterior distributions for the marginal variances are somewhat more similar, with the posterior mean of the marginal spread varying between 0.05 and 0.08. The uncertainty in the estimates of the marginal variance is much higher in Iberia than in Fennoscandia for identical data resolutions. While this might be an indication of structural non-stationarities across Europe, it is also worth noting that the Fennoscandia data set is roughly 3 times larger than that for Iberia (cf. Table 1).
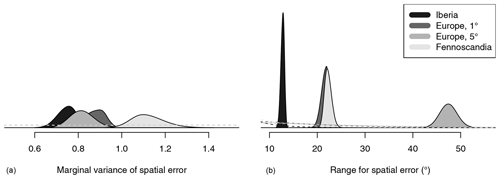
The results for the spatial error terms are presented in Fig. 7. The spatial error field has a much larger range parameter than the spatial trend field (cf. Fig. 6). In particular, the range reaches across nearly the entire study region for the coarsest data resolution. Here, the posterior mean of the marginal spread ranges from 0.86 for the Iberia data to 1.06 for the Fennoscandia data, and the posterior uncertainties are comparable. Note that the marginal variance estimates for the two latent fields cannot be compared, as the associated units are different.
The posterior distributions of the first-lag autocorrelation coefficient φ are given in Fig. 8. As expected, the posterior mean of φ decreases with increased spatial averaging for a coarser grid resolution. φ has a posterior mean of 0.42 for the European grid at 1∘ resolution, while it reduces to 0.17 for the 5∘ resolution. At the finest resolution of 0.5∘, the posterior mean is 0.50 for Iberia and 0.59 for Fennoscandia. Furthermore, these two posterior distributions are non-overlapping, indicating that the assumption of a constant autocorrelation coefficient across all of Europe might generally not hold. However, it is not apparent that there is a direct relationship between the size of the data grid and the spread of the posterior distribution, as the distribution for the largest data grid (1∘ grid over Europe) has a fairly small spread.
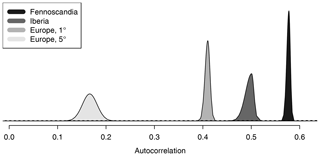
Figure 8Posterior distributions of the first-lag autocorrelation coefficient for all four data sets. The prior distribution is indicated with a black dashed line.
The prior distributions for the marginal variances and the autocorrelation coefficients are very flat around the support of the respective posterior distributions, indicating little influence of the priors on the posterior distributions of these quantities. The prior distributions for the range are automatically adjusted so that the prior median range is a fifth of the approximate diameter of the mesh. We thus get slightly varying shapes of the prior distributions for the different data sets as shown in Fig. 6, with the priors for the high-resolution data sets somewhat more concentrated and centred closer to zero. For the trend fields, all the posterior distributions are more concentrated than the prior distributions. The mean is shifted to lower values for the 5∘ data, for the 1∘ data, and for the 0.5∘ data in Fennoscandia. For the 0.5∘ data in Iberia, the posterior mean of 6.7 is slightly larger than the prior mean of 5.8. For the error fields, all the posterior distributions are substantially shifted to much larger values.
4.4 Residual analysis
A simple model assessment can be performed by considering the in-sample temperature anomaly residuals. Specifically, we define the standardized residuals for spatial location s at time point t as
where is the variance of the error term τst and all parameter estimates are given by the respective posterior mean.
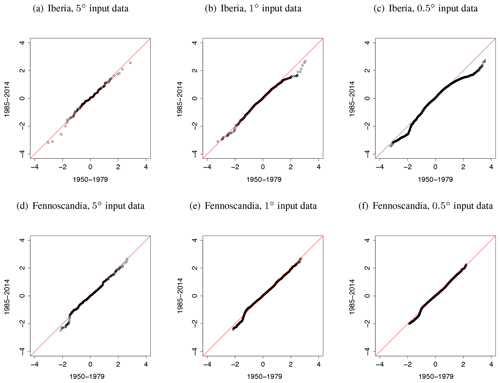
Figure 9Quantiles of standardized temperature anomaly residuals for the different data resolutions in Iberia (a, b, c) and Fennoscandia (d, e, f). Quantiles from the first 30 years of the data period are shown along the x axis, and quantities from the last 30 years are along the y axis. Plots are shown for 5∘ data (a, d), 1∘ data (b, e), and 0.5∘ data (c, f).
Comparing the distribution of the residuals from the first 30 years of the data period to that in the last 30 years gives an indication as to whether the trend in the data has been captured by the model in Eqs. (1) and (2). Standardized residual quantile plots for the different data sets are displayed in Fig. 9. For all the data sets, there is a very good match in the bulk of the distributions between the two time periods. This indicates that the model assumptions regarding temporal changes in the anomalies seem to match the main trends in the data. However, there are some mismatches in the tails of the distributions without there being an overall tendency. For the Iberia plots, the upper tail of the distributions over the period 1950–1979 turn increasingly more heavy than the distributions over the period 1985–2014 as the resolution of the input data increases. The distributions of the Fennoscandia residuals are stable over the various input data sets.
A further assessment concerns the assumption that the residuals follow a Gaussian distribution. This may be assessed by comparing the distribution of the residuals from a certain data set (certain area and grid resolution) to that of a Gaussian distribution with the same first two moments. Such an analysis shows the somewhat expected results that the residuals for the 5∘ data appear nearly perfectly Gaussian, while the residuals for the 1∘ data are slightly heavier tailed, and those for the 0.5∘ data are even further so (results not shown).
Finally it is necessary to remark on the calculation of the residuals for the various resolutions. The computational burden of fitting the temperature trend model in Eq. (1) and Eq. (2) is closely linked to the mesh design used for the estimation. The mesh for the 5∘ and the 0.5∘ data are designed so that there is a near one-to-one correspondence between mesh points and data locations in areas where data are available. Ideally, an analogous setup would be implemented for the 1∘ Europe data. However, to keep the computational load at a manageable level, a design with fewer mesh points than data locations is adopted: there are 1213 data locations, while the entire mesh has 711 mesh points. As a result, each mesh point is associated with positive weights for multiple data points in the INLA data stack that connects data points and mesh points (e.g. Lindgren and Rue, 2015). For ease of comparison across the data resolutions, we have only included data locations that overlap with mesh point locations in our residual analysis (see Fig. 10). Note that this effect does not affect the estimate of the marginal variance in Fig. 7 in that the result there provides a consistent story across the data resolutions.
In this article we propose a spatial trend analysis approach for gridded temperature data, adding spatial components to the univariate trend model used by the IPCC (Hartmann et al., 2013a). While the model and inference approaches are not new, the joint significance assessment of Bolin and Lindgren (2015) has, to the best of our knowledge, not been used in this context before. The latent trend coefficient field is found to have a range far beyond the grid resolution of the data, warranting the spatial structure of the model. The avoidance excursion sets for the spatial significance assessment are overall much smaller than corresponding sets resulting from marginal assessments, supporting previous claims on the need to protect against overstatement and the overinterpretation of multiple-testing results in this setting (Wilks, 2016). For comparison, we have also investigated using the Bonferroni correction to counteract the problem of multiple marginal comparisons (Bonferroni, 1936). This correction–which has been criticized for being conservative–resulted in no rejections of the null hypothesis of no trend.
As an alternative to what is proposed here, controlling the false discovery rate has been shown to work well when the model estimation is performed independently in each grid point location in a frequentist manner (Wilks, 2006, 2016). While its Bayesian interpretation is not entirely straightforward (Storey, 2003), it has been used successfully in Bayesian settings as well (e.g. Müller et al., 2004). In a recent work, Risser et al. (2019) propose an FDR procedure for spatially dependent multiple testing in an application to detect anthropogenic influence on extreme climate events.
The overall area of the avoidance excursion sets decreases with a finer data resolution. However, the finer-resolution sets are not subsets of those obtained using a coarser data resolution with a higher degree of spatial smoothing. This result stresses the necessity of using context-appropriate data to answer questions related to climate change adaptation decision making whenever such data is available. Specifically, higher-resolution data over a smaller area may be used when local information is required. We found it challenging to analyse data sets much larger than those studied here under the current model, indicating that it may be necessary to make the choice between high resolution and spatial extent in the analysis. Simultaneously, our results emphasize the point that any climate change assessment should be accompanied by the appropriate uncertainty quantification.
The model we have applied in this study is fairly simple in structure. When models of this type are estimated independently in each grid point location, it is commonly found that the first-order autocorrelation coefficient φ varies over space. Our results in Fig. 8 for Fennoscandia and Iberia support this claim. However, we found that it was not feasible to include a latent spatial field structure for φ under our inference scheme. The model currently includes two latent GRFs, and adding the third proved computationally challenging. Further generalization of the modelling structure may also be appropriate. For instance, Gneiting et al. (2007) show that a non-separable covariance structure provides a better fit for spatial wind speed data, indicating that similar results may hold for temperatures.
Our analysis focuses on trends in summer temperatures. It is standard practice in climate change studies to focus on annual (e.g. Böhm et al., 2001; Hartmann et al., 2013a; Lorenz and Jacob, 2010; Tietäväinen et al., 2010) and/or seasonal (e.g. Lorenz and Jacob, 2010; Tietäväinen et al., 2010; van der Schrier et al., 2011) changes. In contrast, Craigmile and Guttorp (2011) propose a space–time modelling framework where seasonality is specified as a component of the model. Craigmile and Guttorp (2011) apply their model to 17 locations in southern Sweden and find variations in the seasonal patterns across these locations. While we expect that a careful modelling of seasonality would yield more information about the trend patterns, an analysis over Europe would certainly require spatially varying seasonal components, which, again, are computationally challenging under our inference scheme.
The code and data needed to reproduce the results for the 5∘ data set over Europe are available at: https://github.com/eSACP/STT (Haug, 2019).
TLT formulated the spatiotemporal temperature trends model and provided the literature review. CLEF also contributed to the literature review and was responsible for the E-OBS data collection. SHS documented the SPDE–INLA approach of Sec. 3.2, and OH prepared the R code underlying the model fitting and excursion set analyses. All authors contributed to fine-tuning and proofreading the paper.
The authors declare that they have no conflict of interest.
We acknowledge the EU-FP6 project ENSEMBLES (http://ensembles-eu.metoffice.com, last access: February 2020) which created the E-OBS data set and the data providers in the ECA&D project (http://www.ecad.eu, last access: February 2020). We are grateful to David Bolin, Finn Lindgren, Elias T. Krainski, Fabian Bachl, and Magne Aldrin for providing helpful comments on the modelling approaches and their software implementations. We also thank Christopher Paciorek and two anonymous reviewers for their constructive comments which helped improve the paper.
This research has been supported by the Research Council of Norway (grant no. 229754, “Long-range memory in Earth's climate response and its implications for future global warming”).
This paper was edited by Christopher Paciorek and reviewed by two anonymous referees.
Benjamini, Y. and Hochberg, Y.: Controlling the false discovery rate: a practical and powerful approach to multiple testing, J. Roy. Stat. Soc. Ser. B, 57, 289–300, 1995. a
Blangiardo, M. and Cameletti, M.: Spatial and spatio-temporal Bayesian models with R-INLA, John Wiley & Sons Ltd, Chichester, United Kingdom, 2015. a
Böhm, R., Auer, I., Brunetti, M., Maugeri, M., Nanni, T., and Schöner, W.: Regional temperature variability in the European Alps: 1760–1998 from homogenized instrumental time series, Int. J. Climatol., 21, 1779–1801, 2001. a, b
Bolin, D. and Lindgren, F.: Excursion and contour uncertainty regions for latent Gaussian models, J. Roy. Stat. Soc. Ser. B, 77, 85–106, 2015. a, b, c, d
Bolin, D. and Lindgren, F.: Calculating probabilistic excursion sets and related quantities using excursions, J. Stat. Softw., 86, 1–20, 2018. a
Bonferroni, C.: Teoria statistica delle classi e calcolo delle probabilita, Pubblicazioni del R Istituto Superiore di Scienze Economiche e Commericiali di Firenze, 8, 3–62, 1936. a
Bunde, A., Ludescher, J., Franzke, C. L. E. C., and Büntgen, U.: How significant is West Antarctic warming?, Nature Geosci., 7, 246–247, 2014. a
Chandler, R. and Scott, M.: Statistical methods for trend detection and analysis in the environmental sciences, John Wiley & Sons, 2011. a
Craigmile, P. F. and Guttorp, P.: Space-time modelling of trends in temperature series, J. Time Ser. Anal., 32, 378–395, 2011. a, b, c, d, e, f
Fahrmeir, L. and Tutz, G.: Multivariate statistical modelling based on generalized linear models, 2nd edn. Springer Berlin, 2001. a
Franzke, C. L.: Warming trends: Nonlinear climate change, Nature Clim. Change, 4, 423–424, 2014. a
Franzke, C. L. E.: Long-range dependence and climate noise characteristics of Antarctic temperature data, J. Climate, 23, 6074–6081, 2010. a
Franzke, C. L. E.: Nonlinear trends, long-range dependence, and climate noise properties of surface temperature, J. Climate, 25, 4172–4183, 2012. a
Franzke, C. L. E.: Local trend disparities of European minimum and maximum temperature extremes, Geophys. Res. Lett., 42, 6479–6484, 2015. a
Gao, M. and Franzke, C. L.: Quantile Regression–Based Spatiotemporal Analysis of Extreme Temperature Change in China, J. Climate, 30, 9897–9914, 2017. a
Gneiting, T., Genton, M. G., and Guttorp, P.: Geostatistical space-time models, stationarity, separability, and full symmetry, in: Statistics of Spatio-Temporal Systems, edited by: Isham, V., Finkelstadt, B., and Härdle, W., 151–176, Taylor & Francis, Boca Raton, FL, 2007. a
Hartmann, D., Klein Tank, A. M. G., Rusticucci, M., Alexander, L. V., Brönnimann, S., Charabi, Y., Dentener, F. J., Dlugokencky, E. J., Easterling, D. R., Kaplan, A., Soden, B. J., Thorne, P. W., Wild, W., and Zhai, P. M.: Observations: Atmosphere and Surface, in: Climate Change 2013: The Physical Science Basis, Contribution of Working Group I to the Fifth Assessment Report of the Intergovernmental Panel on Climate Change, edited by: Stocker, T., Qin, D., Plattner, G.-K., Tignor, M., Allen, S. K., Boschung, J., Nauels, A., Xia, Y., Bex, V., and Midgley, P. M., 159–254, Cambridge University Press, Cambridge, United Kingdom and New York, NY, USA, 2013a. a, b, c, d, e, f, g
Hartmann, D., Klein Tank, A. M. G., Rusticucci, M., Alexander, L. V., Brönnimann, S., Charabi, Y., Dentener, F. J., Dlugokencky, E. J., Easterling, D. R., Kaplan, A., Soden, B. J., Thorne, P. W., Wild, W., and Zhai, P. M.: Observations: Atmosphere and Surface Supplementary Material, in: Climate Change 2013: The Physical Science Basis. Contribution of Working Group I to the Fifth Assessment Report of the Intergovernmental Panel on Climate Change, edited by: Stocker, T., Qin, D., Plattner, G.-K., Tignor, M., Allen, S. K., Boschung, J., Nauels, A., Xia, Y., Bex, V., and Midgley, P. M., Cambridge University Press, Cambridge, United Kingdom and New York, NY, USA, available at: http://www.climatechange2013.org/ (last access: February 2020) and https://www.ipcc.ch/ (last access: February 2020), 2013b. a
Haug, O.: Spatial temperature trend estimation with SPDE-INLA, available at: https://github.com/eSACP/STT (last access: 19 February 2020), 2019. a
Haylock, M., Hofstra, N., Klein Tank, A., Klok, E., Jones, P., and New, M.: A European daily high-resolution gridded data set of surface temperature and precipitation for 1950–2006, J. Geophys. Res.-Atmos., 113, https://doi.org/10.1029/2008JD010201, 2008. a, b
Hofstra, N., Haylock, M., New, M., Jones, P., and Frei, C.: Comparison of six methods for the interpolation of daily, European climate data, J. Geophys. Res.-Atmos., 113, https://doi.org/10.1029/2008JD010100, 2008. a
Krainski, E. T., Gómez-Rubio, V., Bakka, H., Lenzi, A., Castro-Camilo, D., Simpson, D., Lindgren, F., and Rue, H.: Advanced spatial modeling with stochastic partial differential equations using R and INLA, Chapman and Hall/CRC, 2018. a
Lindgren, F. and Rue, H.: Bayesian spatial modelling with R-INLA, J. Stat. Softw., 63, https://doi.org/10.18637/jss.v063.i19, 2015. a, b, c, d
Lindgren, F., Rue, H., and Lindström, J.: An explicit link between Gaussian fields and Gaussian Markov random fields: the stochastic partial differential equation approach, J. Roy. Stat. Soc. Ser. B, 73, 423–498, 2011. a, b, c, d
Livezey, R. E. and Chen, W.: Statistical field significance and its determination by Monte Carlo techniques, Mon. Weather Rev., 111, 46–59, 1983. a
Lorenz, E. N.: Nondeterministic theories of climatic change, Quaternary Res., 6, 495–506, 1976. a
Lorenz, P. and Jacob, D.: Validation of temperature trends in the ENSEMBLES regional climate model runs driven by ERA40, Clim. Res., 44, 167–177, 2010. a, b, c
Ludescher, J., Bunde, A., Franzke, C. L. E., and Schellnhuber, H. J.: Long-term persistence enhances uncertainty about anthropogenic warming of Antarctica, Clim. Dynam., 46, 263–271, 2015. a
Matérn, B.: Spatial variation, Tech. Rep. 49(5), Forest Research Institute of Sweden, 1960. a
Müller, P., Parmigiani, G., Robert, C., and Rousseau, J.: Optimal sample size for multiple testing: the case of gene expression microarrays, J. Am. Stat. Assoc., 99, 990–1001, 2004. a
New, M., Hulme, M., and Jones, P.: Representing twentieth-century space–time climate variability. Part II: Development of 1901–96 monthly grids of terrestrial surface climate, J. Climate, 13, 2217–2238, 2000. a
Risser, M. D., Paciorek, C. J., and Stone, D. A.: Spatially Dependent Multiple Testing Under Model Misspecification, With Application to Detection of Anthropogenic Influence on Extreme Climate Events, J. Am. Stat. Assoc., 114, 61–78, 2019. a
Rue, H., Martino, S., and Chopin, N.: Approximate Bayesian inference for latent Gaussian models by using integrated nested Laplace approximations (with discussion), J. Roy. Stat. Soc. Ser. B, 71, 319–392, 2009. a, b
Rue, H., Riebler, A., Sørbye, S. H., Illian, J. B., Simpson, D. P., and Lindgren, F. K.: Bayesian computing with INLA: A review, Annu. Rev. Stat. Appl., 4, 395–421, 2017. a
Santer, B. D., Thorne, P., Haimberger, L., Taylor, K. E., Wigley, T., Lanzante, J., Solomon, S., Free, M., Gleckler, P. J., Jones, P., Karl, T. R., Klein, S. A., Mears, C., Nychka, D., Schmidt, G. A., Sherwood, S. C., and Wentz, F. J.: Consistency of modelled and observed temperature trends in the tropical troposphere, Int. J. Climatol., 28, 1703–1722, 2008. a
Scinocca, J., Stephenson, D. B., Bailey, T. C., and Austin, J.: Estimates of past and future ozone trends from multimodel simulations using a flexible smoothing spline methodology, J. Geophys. Res.-Atmos., 115, D00M12, https://doi.org/10.1029/2009JD013622, 2010. a
Seidel, D. J. and Lanzante, J. R.: An assessment of three alternatives to linear trends for characterizing global atmospheric temperature changes, J. Geophys. Res.-Atmos., 109, D14108, https://doi.org/10.1029/2003JD004414, 2004. a
Stocker, T., Qin, D., Plattner, G.-K., Tignor, M., Allen, S. K., Boschung, J., Nauels, A., Xia, Y., Bex, V., and Midgley, P. M. (Eds.): Climate Change 2013: The Physical Science Basis. Contribution of Working Group I to the Fifth Assessment Report of the Intergovernmental Panel on Climate Change, Cambridge University Press, Cambridge, United Kingdom and New York, NY, USA, 2013. a
Storey, J. D.: The positive false discovery rate: a Bayesian interpretation and the q-value, Ann. Stat., 31, 2013–2035, 2003. a
Thorarinsdottir, T. L., Guttorp, P., Drews, M., Kaspersen, P. S., and de Bruin, K.: Sea level adaptation decisions under uncertainty, Water Resour. Res., 53, 8147–8163, 2017. a
Tietäväinen, H., Tuomenvirta, H., and Venäläinen, A.: Annual and seasonal mean temperatures in Finland during the last 160 years based on gridded temperature data, Int. J. Climatol., 30, 2247–2256, 2010. a, b, c, d
van der Schrier, G., van Ulden, A., and van Oldenborgh, G. J.: The construction of a Central Netherlands temperature, Clim. Past, 7, 527–542, https://doi.org/10.5194/cp-7-527-2011, 2011. a, b, c
van der Schrier, G., van den Besselaar, E. M., Klein Tank, A., and Verver, G.: Monitoring European average temperature based on the E-OBS gridded data set, J. Geophys. Res.-Atmos., 118, 5120–5135, 2013. a
von Storch, H. and Zwiers, F. W.: Statistical analysis in climate research, Cambridge University Press, Cambridge, United Kingdom, 1999. a, b
Whittle, P.: On stationary processes in the plane, Biometrika, 41, 434–449, 1954. a
Wilks, D.: On “field significance” and the false discovery rate, J. Appl. Meteorol. Climatol., 45, 1181–1189, 2006. a, b, c
Wilks, D. S.: “The stippling shows statistically significant gridpoints”: How Research Results are Routinely Overstated and Over-interpreted, and What to Do About It, B. Am. Meteorol. Soc., 97, 2263–2273, 2016. a, b, c, d
Wu, Z., Huang, N. E., Long, S. R., and Peng, C.-K.: On the trend, detrending, and variability of nonlinear and nonstationary time series, P. Natl. Acad. Sci., 104, 14889–14894, 2007. a


