the Creative Commons Attribution 4.0 License.
the Creative Commons Attribution 4.0 License.
 | 15 Mar 2022
Spatial heterogeneity of 2015–2017 drought intensity in South Africa's winter rainfall zone
Willem Stefaan Conradie
Piotr Wolski
Bruce Charles Hewitson
The 2014–2018 drought over South Africa's winter rainfall zone (WRZ) created a critical water crisis which highlighted the region's drought and climate change vulnerability. Consequently, it is imperative to better understand the climatic characteristics of the drought in order to inform regional adaptation to projected climate change. In this paper we investigate the spatio-temporal patterns of drought intensity and the recent rainfall trends, focusing on assessing the consistency of the prevailing conceptual model of drought drivers with observed patterns. For this we use the new spatial subdivision for the region encompassing the WRZ introduced in our companion paper (Conradie et al., 2022).
Compared to previous droughts since 1979, the 2014–2018 drought in the WRZ core was characterised by a markedly lower frequency of very wet days (exceeding the climatological 99.5th percentile daily rainfall – including dry days) and of wet months (SPI1>0.5), a sub-seasonal attribute not previously reported. There was considerable variability in the spatial footprint of the drought. Short-term drought began in the south-western core WRZ in spring 2014. The peak intensity gradually spread north-eastward, although a spatially near-uniform peak is seen during mid-2017. The overall drought intensity for the 2015–2017 period transitions radially from most severe in the WRZ core to least severe in the surroundings. During 2014 and 2015, the drought was most severe at those stations receiving the largest proportion of their rainfall from westerly and north-westerly winds; by 2018, those stations receiving the most rain from the south and south-east were most severely impacted. This indicates an evolving set of dynamic drivers associated with distinct rain-bearing synoptic flows.
No evidence is found to support the suggestion that the drought was more severe in the mountain catchments of Cape Town's major supply reservoirs than elsewhere in the core nor that rain day frequency trends since 1979 are more negative in this subdomain. Rainfall and rain day trend rates also exhibit some connections to the spatial seasonality structure of the WRZ, although this is weaker than for drought intensity. Caution should be applied in assessing South African rain day trends given their high sensitivity to observed data shortcomings. Our findings suggest an important role for zonally asymmetric dynamics in the region's drought evolution. This analysis demonstrates the utility of the spatial subdivisions proposed in the companion paper by highlighting spatial structure in drought intensity evolution linked to rainfall dynamics.
- Article
(4223 KB) - Full-text XML
- Companion paper
- BibTeX
- EndNote


Between 2015 and 2017 South Africa's winter rainfall zone (WRZ) saw its most severe 3-year drought in more than a century of rainfall records – with a return period of more than 300 years in the southern WRZ (SWRZ) (Wolski, 2018; Wolski et al., 2020). This event – commonly referred to as the “Day Zero Drought” after the consequent water crisis – exposed the WRZ's vulnerability to drought stress, leading to renewed interest in this climatically and ecologically complex and sensitive region (e.g. Sousa et al., 2018; Odoulami et al., 2021). Drastic measures were implemented to limit urban and agricultural water consumption in order to avoid cutting off the water supply to Cape Town, with severe consequences for rural and urban livelihoods (Archer et al., 2019; Ziervogel, 2018; Matikinca et al., 2020; Enqvist and Ziervogel, 2019).
The drought was widely seen as a precursor to increasingly severe drought occurrences in the 21st century (Pascale et al., 2020) – i.e. drought as the “new normal” (Bischoff-Mattson et al., 2020). The WRZ can be described as having a Mediterranean-like climate – a term used to refer to regions with winter-dominant rainfall seasonality, similar to that of Mediterranean-type climate zones but without upper or lower bounds on absolute annual or monthly rainfall. As with the regions in the Mediterranean, Australia and South America experiencing a similar climate, climate change simulations and studies consistently project considerable 21st century drying (Engelbrecht et al., 2009; Niang et al., 2014; Collins et al., 2013; Polade et al., 2017; Hoegh-Guldberg et al., 2018; Maure et al., 2018; Seager et al., 2019) and more frequent droughts in the WRZ (Naik and Abiodun, 2019) – especially during early winter, when the Day Zero Drought was most intense (Mahlalela et al., 2019; Pascale et al., 2020). In addition to the threat to urban water security and rural livelihoods, such drying would threaten the succulent Karoo of the northern WRZ (NWRZ, or Namaqualand, the world's only semi-arid biodiversity hotspot, Myers et al., 2000) and the hyper-diverse fynbos shrubland of the SWRZ (Altwegg et al., 2014; Midgley and Thuiller, 2007; Midgley and Bond, 2015). In a companion paper (Conradie et al., 2022) a detailed description of the physical geography of the WRZ and its immediate surroundings is provided; a topographical map depicting regions discussed in this paper is reproduced here as Fig. A1.
To date, the Day Zero Drought has been assessed usually as an essentially temporally and spatially uniform event associated with a fixed set of drivers by season (e.g. Mahlalela et al., 2019; Wolski, 2018; Burls et al., 2019). The primary mechanisms identified thus are a set of interconnected, observed dynamic changes associated with multi-decadal trends. They form the basis for the prevailing conceptual model of drought drivers in the WRZ. The key feature is an essentially zonally symmetric poleward shift in atmospheric circulation features and associated weather systems, specifically the poleward contraction of the South Atlantic westerly wind belt and associated storm and frontal tracks, the southward migration of moisture transport corridors, persistently positive Southern Annular Mode polarity, poleward expansion of the Hadley circulation and associated subtropical subsistence, enhanced atmospheric stability, and a consequently shorter wet season (Burls et al., 2019; Sousa et al., 2018; Archer et al., 2019; Pascale et al., 2020; Mahlalela et al., 2019; Odoulami et al., 2020). Since modelling studies overwhelmingly also project such shifts in response to increased radiative forcing (e.g. Polade et al., 2017; Mahlalela et al., 2019; Naik and Abiodun, 2019; Seager et al., 2019; Pascale et al., 2020), this conceptual model implies further anthropogenically forced increases in WRZ drought frequency and intensity in the 21st century (Otto et al., 2018). Burls et al. (2019) also find that the number of rain days per year over the SWRZ has been steadily decreasing since the early 20th century, with an apparent acceleration in the mountainous water catchment regions since the 1980s. However, observed long-term rainfall trends are weak or absent over most of the region (MacKellar et al., 2007, 2014; Hoffman et al., 2011; Kruger and Nxumalo, 2017; Burls et al., 2019). The centennial-scale records are dominated by quasi-oscillatory behaviour with a period of ≈40 years (Wolski et al., 2020; Ndebele et al., 2019; Du Plessis and Schloms, 2017). The significant trends observed in Climatic Research Unit (CRU) rainfall series (Otto et al., 2018; Seager et al., 2019) appear to be the result of a bias introduced to the dataset by dramatically reduced available station numbers in recent decades predominantly affecting wetter stations (Wolski et al., 2020).
Furthermore, like many other Mediterranean-like climate regions, the WRZ is characterised by very large spatial gradients in many climatic variables related to high topographic heterogeneity (Bradshaw and Cowling, 2014) and large temperature gradients between an arid subtropical interior and cold eastern boundary current (the Benguela: Aschmann, 1973; Mahlalela et al., 2019, see also Conradie et al., 2022). Aligned with this subregional structure, shorter-term trends exhibit considerable seasonal and spatial heterogeneity that is not easily explained by the conceptual drought model outlined above (Wolski et al., 2020; MacKellar et al., 2007; Altwegg et al., 2014, and references therein). In addition, the extra-tropical Southern Hemisphere palaeoclimatic record contains complexities not easily explained purely by westerly storm track shifts (Stager et al., 2012).
However, despite the considerable work done on the characteristics, drivers and impacts of the Day Zero Drought, a systematic analysis of the associations of spatial intensity of drought and recent rainfall trends has not been conducted. Among studies of the drought drivers, only Abba Omar and Abiodun (2020) find a mechanistic link between a rainfall variability driver (cut-off low (COL) frequency) and the spatial pattern of drought intensity. COL frequency is found to influence rainfall variability in the south-eastern WRZ and immediate surroundings much more than in the WRZ core – consistent with the findings of Favre et al. (2013) – as a result of the characteristic moisture source and circulation patterns associated with COLs near the WRZ (Abba Omar and Abiodun, 2021). In our companion paper (Conradie et al., 2022), an approach to studying the spatial structure of the WRZ is introduced. Here we apply it to identify coherent spatial patterns in the evolution of the Day Zero Drought intensity and recent rainfall and rain day trends.
2.1 Datasets
We use the comprehensively cleaned 105-station 1979–2018 WRZ dataset described in Conradie et al. (2022) and wind direction–rainfall relationships found therein. For comparison, Global Precipitation Climatology Centre (GPCC) version 2020 Full Data Monthly Product (Schneider et al., 2020) gridded data are used. Circulation weather types (CWTs) based on wind direction data are obtained from the European Centre for Medium-Range Forecasts (ECMWF) Re-Analysis 5 (ERA5; Hersbach et al., 2020), as in Conradie et al. (2022). A description of the study domain and list of place names used can also be found in Conradie et al. (2022).
2.2 Methods
2.2.1 Standard Precipitation Index calculations
The Standard Precipitation Index (SPI; McKee et al., 1993) is the primary measure of drought intensity in this study. The precipitation data are fitted to Gamma distributions. The discrete probability of zero precipitation over the period is estimated separately, so that effectively a mixed distribution is used (see Stagge et al., 2016, for details). SPI values are computed for area-aggregated rainfall by the annual variability clusters and seasonality domain obtained in Conradie et al. (2022). The variability clusters are depicted in Fig. A2 and seasonality domains in Fig. A3. The aggregated 1- and 3-month (for standard meteorological seasons) SPI values, in particular, are used to identify notably dry or wet months and seasons. Spatial SPI patterns in station data are investigated at the 12-, 36- and 48-month timescales. This selection was made since, in previous studies of the drought, the greatest drought severity in 2017 and 2018 was found to have occurred at these timescales (e.g. Wolski, 2018; Mahlalela et al., 2019; Kam et al., 2021). We focus on hydrological years (starting in September) unless otherwise indicated, as (a) this allows us to assess drought patterns from the start of the meteorological drought in September 2014 (see Fig. 1), (b) for most stations we have data only to the end of October 2018 and (c) drought intensity patterns tend to show greater coherence for hydrological than calendar years. The relationships between CWT contributions and drought intensity evolution are studied to gain insight into the possible mechanisms driving spatial heterogeneity in drought intensity. Station-based analyses are compared to GPCC SPI values over south-western southern Africa derived from the entire 1891–2019 data period. For the station data, in contrast, it should be noted that all SPI calculations are based on a 40-year reference period that excludes previous extreme multi-year droughts in the 1920s, 1930s, 1960s and 1970s (see Wolski et al., 2020; Pascale et al., 2020) and hence tends to overestimate drought severity. However, Wolski et al. (2020) clearly demonstrate that 2015–2017 drought intensity remains extreme even when using a ≈120-year reference period.
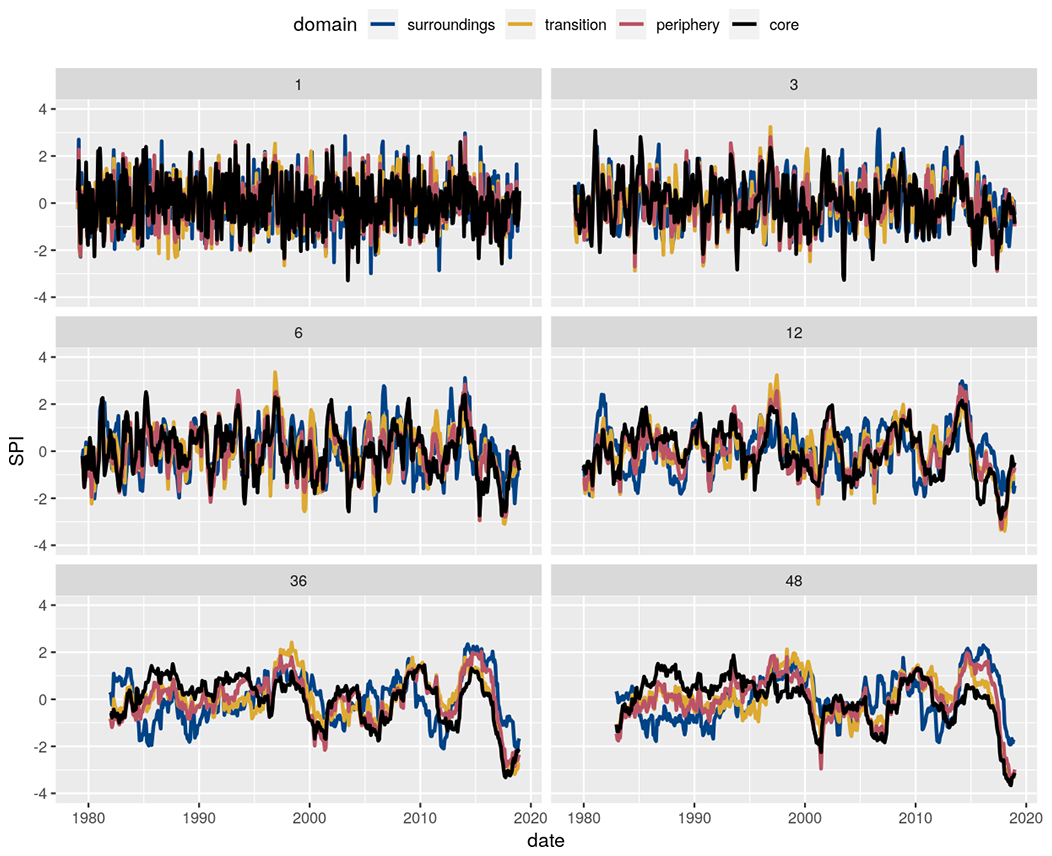
Figure 1SPI time series by timescale in months (panel header). The spatial domains considered are those discussed in Sect. 5 of Conradie et al. (2022) and mapped in Fig. A3.
2.2.2 Very wet and very dry months
We identify very wet and very dry months and seasons relative to climatological monthly means and variance using the SPI. In addition, we consider very wet and very dry months relative to annual and wet season climatological monthly means at each station. This allows us to identify months that substantially affect the annual anomalies and hence the drought risk, referred to as “consequential” wet (or dry) months. At a given station, a consequential wet month relative to the wet season is defined as occurring when more than 1.5 times the mean rainfall for the climatologically wettest month at that station is observed. This definition is more applicable in areas with strong seasonality. Hence, we also apply an alternative definition that identifies months – referred to as consequential wet months relative to mean annual rainfall (MAR) – during which the daily mean rainfall is greater than 3.65 times the climatological daily rainfall. This is more appropriate for relatively aseasonal rainfall zones without a well-defined wet season to compare anomalies to. “Consequentially” dry months are defined as occurring when the rainfall anomaly for that month (relative to the monthly climatology) is negative and exceeds in absolute value 12 % of the station MAR.
2.2.3 Very wet days
Very wet days are also identified individually at each station, using the 99.5th percentile daily rainfall values – computed using rainfall recordings from all days, including dry days. Given that the average dry day frequency is about 80 % in the WRZ core, over this domain the 99.5th percentile daily rainfall values correspond, on average, roughly to the 97.5th percentile rain day intensity.
2.2.4 Correlations
Correlations are computed between various continuous variables evaluated at each of the stations. Correlations presented, unless otherwise indicated, are therefore computed across stations rather than over time. The R2 and corresponding p values are presented for the standard Pearson correlation co-efficient. Since not all variables considered are necessarily normally distributed, the robustness of the obtained values is assessed using the Spearman rank correlation (denoted as ρS). Unless otherwise stated, p values for correlations reported hold for ρS as well.
2.2.5 Trends
Following Wolski (2018) and Burls et al. (2019), pre-whitened (Yue et al., 2002) Theil–Sen trends (Sen, 1968) are computed; ordinary least squares regressions are also performed for comparison. Note that pre-whitening is performed only for Theil–Sen trends and for no other component of the analysis. Multivariate ordinary least squares regression models (OLS models) are used to investigate the combined influence of various factors on spatial patterns of drought intensity and rainfall trends. Models incorporating additional variables are reported only when they yield a lower Bayesian information criterion (BIC) value than a simpler model. It should be noted that this component of the study is an exploratory, hypothesis-generating analysis.
2.2.6 Rain day analyses
We perform rain day assessments using both 0.2 (as in Burls et al., 2019) and 1 mm thresholds for rainfall occurrence. To investigate rain intensity characteristics of the Day Zero Drought, very wet days are defined as days when the 99.5th percentile of daily rainfall (evaluated over the full record) is exceeded. The identification of very wet or dry months and days is conducted at the station scale before occurrences are tallied by spatial aggregation variable.
2.2.7 Topographic classifications
To assess whether stations in mountain catchments – or mountainous regions more generally – were more severely affected during this drought, we use two sets of criteria to classify the topography of each station location. These criteria are outlined in Sect. A1.
3.1 Temporal evolution of the drought
Drought intensity is considered in the WRZ seasonality domains; see Fig. A3 for the spatial extent of these zones and Conradie et al. (2022), Sect. 5 for details about how their spatial extent is determined. In the WRZ core and periphery and transition zones at the 1- and 3-year timescales, the meteorological drought peaked in intensity between August and December 2017 and was most severe in the 40-year satellite-era record (Fig. 1). In August 2017, the peak of the drought in the core, the 36-month SPI slopes downward monotonically from the surroundings to the core. The minima in 6- and 48-month SPI values were also recorded during this drought: in May 2015 or May 2017 (6-month) and late 2018 (48-month). In the core, especially, drought intensity increased with increasing timescale, highlighting persistence of near- or below-normal rainfall as the dominant characteristic of the Day Zero Drought in the core WRZ. In the periphery and transition, the 3-, 6- and 12-month anomalies between May and September 2017 were also extreme (). Whereas 1- and 3-month SPI minima occurred during the 2003–2004 drought period – when very large rainfall deficits were recorded during the peak rainy season months of May and June in the core and periphery – a few relatively wet months alleviated the long-term intensity of that event.
In contrast, the striking characteristic of 1- and 3-month SPI series during the Day Zero Drought in the WRZ core is the near absence of substantially positive SPI values. This is clearly apparent in SPI series from the drought period for SW and CPT annual variability clusters (Fig. 2; see Fig. A2 for their spatial extent). Together, the SW and CPT clusters make up much of the WRZ core (as can be seen in comparing Figs. A2 and A3 and as is discussed in detail in Conradie et al., 2022). Starting in April (September) 2014, the number of months for which SPI1 in the core exceeds 0.25, 0.5, 0.75 and 1 are 16 (12), 7 (5), 2 (1) and 1 (1) of the 57 (52) months respectively. Restricting the assessment to the 25 AMJJAS months from September 2014 yields 5, 2, 0 and 0.
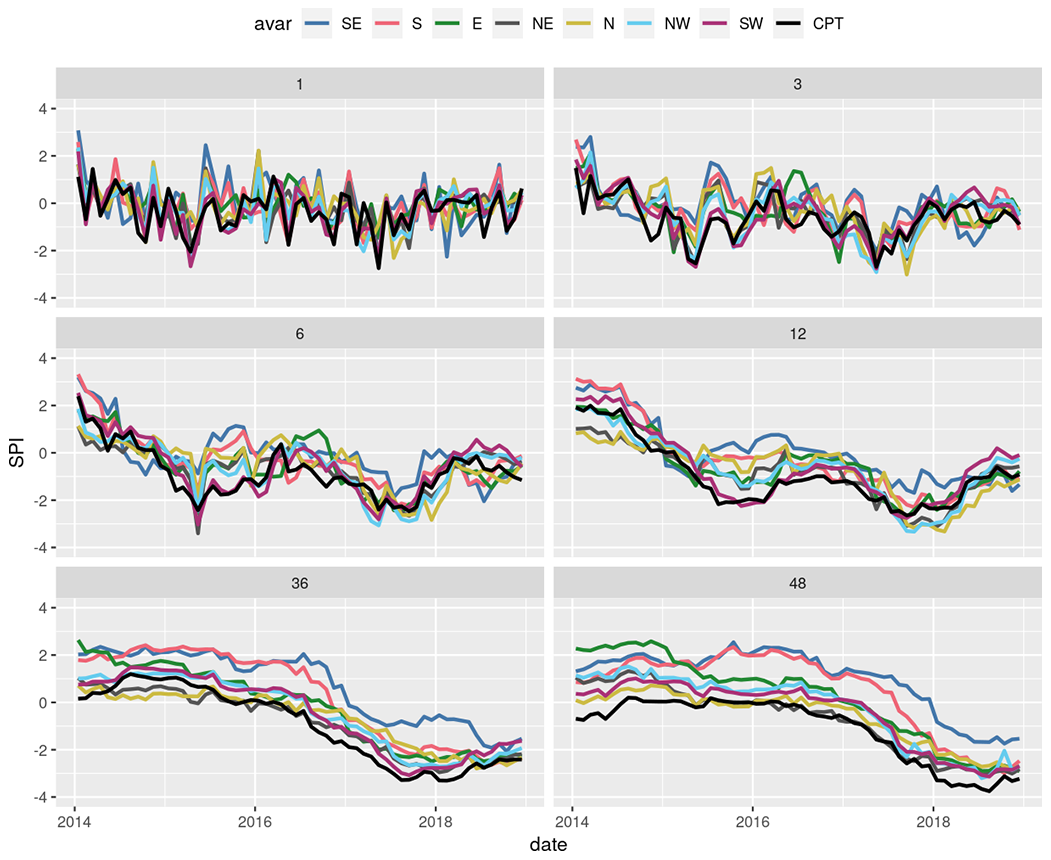
Figure 2As in Fig. 1 but for the period 2014–2018 only and considering the annual variability clusters of Conradie et al. (2022) mapped in Fig. A2.
We now seek to quantify how unusual such sequences are. The lag-1 autocorrelation of the WRZ core monthly rainfall anomaly (and SPI1) time series is very small (ρ1=0.008) and not statistically significantly different from 0 (p>0.1). Considering AMJJAS data only yields ρ1=0.061; p>0.05, suggesting that the winter period does not exhibit significantly stronger memory than ONDJFM. Looking at correlations between each set of consecutive months (not shown) further confirms that there is little or no month-to-month memory in WRZ core rainfall series. This appears to apply to all seasons. Assuming then that the SPI values follow a standard normal distribution (by construction) and that any monthly SPI value exceeding the threshold S is an independent event, the probability of observing x out of n months exceeding S is binomially distributed, more precisely, denoting by X the random variable indicating the number of months exceeding S and by Φ(x) the cumulative density function of the standard normal distribution: . For months since April 2014 and , the approximate probabilities of no more than the observed number of months exceeding the SPI thresholds in the WRZ core are , suggesting an exceptionally rare sequence. In comparison, we consider the 4 driest years in the WRZ core in the 1979–2013 period: 2000, 2003, 2004 and 2011. Out of these 48 months, the number of occurrences of SPI1 exceeding 0.25, 0.5, 0.75 and 1 are 12, 10, 5 and 4 respectively; the corresponding values for PX(S) are , and 0.1. Hence, during these earlier drought periods, very wet months were relatively infrequent, but not dramatically so. In contrast, both the Day Zero Drought period (September 2014 to August 2018) and the set of earlier dry years saw 2 months with and 6 months with . This suggests that the larger cumulative precipitation deficit in the WRZ core during the Day Zero period (−812 mm) compared to that for the 4 driest other years (−640 mm) is not the result of more severe or more frequent extremely dry months; rather, the near absence of substantial wet anomalies was key.
Considering standard meteorological seasons (DJF, MAM, JJA, SON), MAM 2017 and MAM 2015 saw the second- and third-lowest SPI3 values in the WRZ core ( in both cases) and the lowest and fourth-lowest SPI3 values in the periphery ( in both cases). MAM 2017 also saw the second-lowest seasonal SPI in the surroundings and periphery. This is consistent with the findings of numerous Day Zero Drought studies that very dry shoulder seasons – and autumns especially – were characteristic of this drought (e.g. Mahlalela et al., 2019; Sousa et al., 2018; Archer et al., 2019). None of the other multi-year droughts in the 40-year record saw more than one meteorological season with in the core. However, if other sets of 3-month seasons are considered, the 2003–2004 drought included an even more extreme season (AMJ and MJJ 2003 saw ). Nonetheless, under the same assumptions made for the months above, the probability of at least two meteorological seasons in a given 4-year period (e.g. 2015–2018) with is less than . Since the autocorrelation of the standard meteorological seasons SPI3 series is somewhat larger and marginally statistically significant (ρ1=0.14; ), we also estimate the probability of observing two cases of in 16 seasons using 106 randomly generated first-order autoregressive series with the same lag-1 autocorrelation (ρ1=0.14). This yields an only marginally higher value of , confirming the exceptional nature of the MAM 2015 and 2017 anomalies.
We now consider the frequency of consequential wet and dry months, as defined in Sect. 2.2.2, and of very wet days as defined in Sect. 2.2.6. During the Day Zero period in the WRZ core, consequential wet months relative to the wet season or MAR occurred at roughly 20 % of the rate observed over 1979–2013. No consequential wet months of either type were observed during 2017 or 2018 in the periphery. In contrast, the frequency of consequential dry months during the Day Zero Drought, across the true WRZ (the union of the core and periphery), was less than half that recorded during the 2003–2005 drought. The frequency of very wet days was also much lower during the Day Zero Drought than the preceding part of the satellite-era record, including previous drought periods. In particular, the frequency of very wet days in 2017 was the lowest on record in the core and periphery, where values were below 20 % of the 40-year mean; the next driest years in the core were 1999 and 2018, at approximately 41 % of the 40-year mean. Together with the above SPI-based analysis, this suggests that the lack of wet months and very wet days was at least as much a driver of the severity of the Day Zero Drought in the true WRZ as the frequency of very dry months and reduced number of rain days. See Sect. 4.4 for further discussion.
3.2 Correlates of the spatial pattern of drought evolution
The spatial pattern of drought intensity (here quantified by a 12-month SPI or SPI12) was markedly different in 2015, 2016, 2017, and 2018 (Fig. 3). Between 2015 and 2018, the drought shifted from being highly concentrated in the south-western WRZ to predominantly affecting the north-eastern transitional and south-eastern surrounding areas. The drought was far more widespread and uniform in 2017 than the other years. Shorter-timescale (1-, 3- and 6-month) SPI values over AMJJAS 2017 exhibit remarkable uniformity across seasonality domains (Fig. 1) and annual variability clusters (Fig. 2). During AMJJAS 2015, in contrast, the values vary considerably.
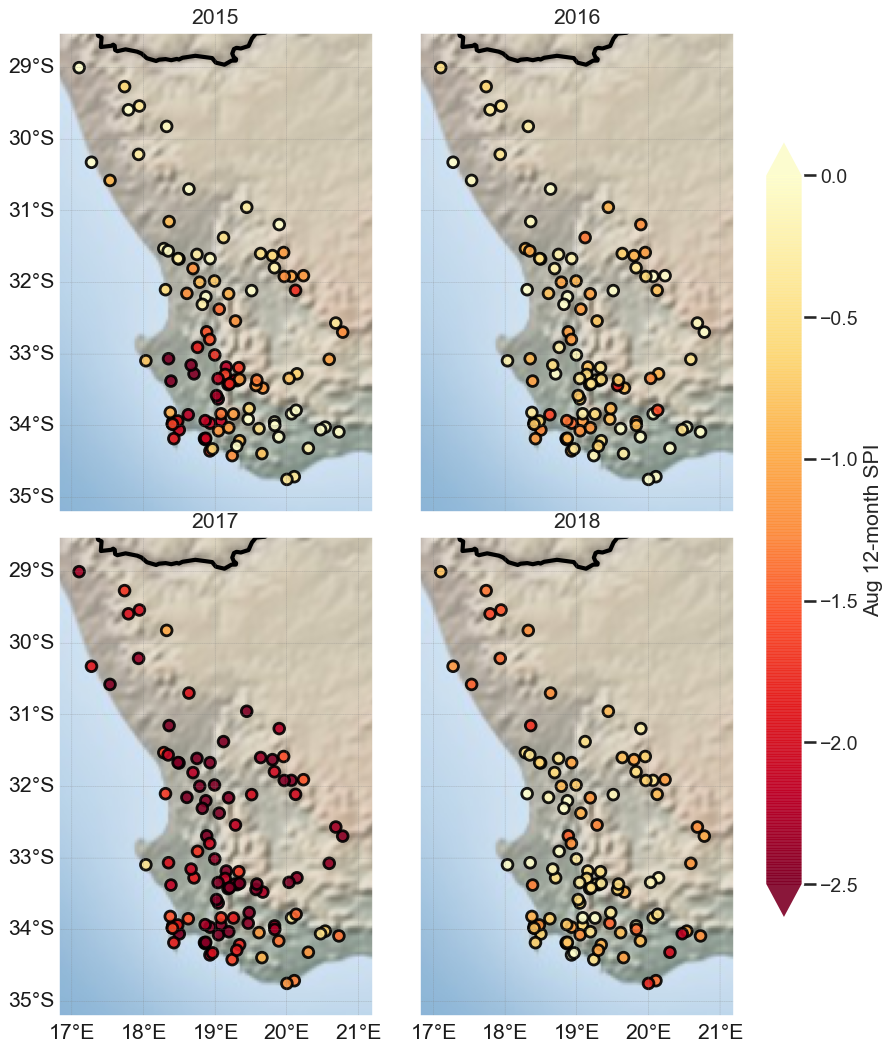
Figure 3Twelve-month SPI for the periods ending in August of the years indicated.
At most stations in the WRZ core and northern periphery and transition (domains mapped in Fig. A3), drought intensity peaked in 2017. Consistent with Wolski (2018) and Wolski et al. (2020), we find a number of stations to have experienced extreme medium-term drought (; τ12≳160 years) in 2015 (5 out of 105 stations) and 2017 (30 out of 105 stations) but none during 2016 or 2018. Drought intensity in 2016 was much weaker and less spatially coherent than in either 2015 and 2017, with only isolated stations in the west and south-west experiencing moderately severe drought (here implying ; approximate corresponding return interval: τ12≳15 years).
Drought intensity for 2015 in the WRZ station dataset is closely related to the climatological proportion of rainfall occurring with westerly, south-westerly or north-westerly synoptic flow (i.e. under the W, SW and NW CWTs, denoted collectively as W_all). Correlating the climatological W_all CWT rainfall contributions with August 2015 SPI12 across all 105 stations yields R2=0.47; ; considering the WRZ core stations only yields R2=0.25; . In both the full station set and the WRZ core, the climatological CWT contribution from the easterly sectors (E_all) was strongly anti-correlated with drought intensity (WRZ: R2=0.42; core: R2=0.39), suggesting an enhanced easterly contribution to 2015 rainfall totals. Monthly and seasonal (1- and 3-month) drought intensity peaked in early winter (Mahlalela et al., 2019; Sousa et al., 2018) and spring (hence, during AMJJAS), causing stations more dependent on AMJJAS rains to suffer more severe drought. However, the correlation between the climatological proportion of rainfall occurring during AMJJAS (denoted by %AMJJAS) and August 2015 SPI12 in the core is not statistically significant (R2=0.07; p>0.05) and over the WRZ is high but substantially weaker (R2=0.24) than for the W_all CWT contributions. This suggests that drought intensity in 2015 was directly caused in part by reduced westerly moisture input rather than exclusively by other factors with similar spatial footprints, such as increased atmospheric stability in post-frontal air masses (Burls et al., 2019), a delayed onset of the winter rainy season (Mahlalela et al., 2019) or drier conditions being focussed during AMJJAS. Stations further south tended to experience more severe drought in 2015 (for latitude R2=0.12; p<0.001), particularly in the core (R2=0.25; , for ρS; p<0.05). This is likely because of the severe shortfalls during spring (SON) 2014 in the WRZ core, a season during which western South African rainfall is mostly limited to the southern coastal and mountain belts (Conradie et al., 2022).
To further explore factors responsible for the spatial pattern of 2015 drought intensity, we constructed an OLS model from selected station metadata variables. Including climatological contributions from the NW, W, SW, S, SE, E, NE and IF CWTs, longitude, and %AMJJAS yields R2=0.74, suggesting dominant systematic drivers of the drought intensity pattern. In contrast, similar models for all later years yield considerably weaker results (R2<0.5). Notably, elevation was not retained as an explanatory variable in any year.
During 2016, the correlation between the climatological W_all CWT rainfall contribution and August SPI12 is relatively weak (R2=0.13) but significant (p<0.005). COL events during winter detected by Abba Omar and Abiodun (2020) caused locally heavy rainfall events, as did an intense subtropical convective system in January 2016 in the NWRZ (Helme and Schmiedel, 2020). Thus, individual rainfall events appear to have been dominantly responsible for the spatially patchy drought intensity pattern of 2016.
For 2017, climatological W_all CWT contributions are again relatively strongly negatively associated with SPI but not as dominantly as in 2015 (R2=0.20). A similarly strong negative correlation is found with %AMJJAS (R2=0.25). However, these correlations are weak and statistically insignificant when limiting the stations considered to those in the WRZ core. This implies that the observed correlations may be the result of other unconsidered factors, such as local weather systems occurring outside the WRZ core, where %AMJJAS is highest. The SPI–latitude association in 2017 was opposite to that of 2015: more equatorward stations were more severely impacted than those in the south (R2=0.05; p<0.05; for the 2017 calendar year: R2=0.27; ). The stronger correlations for the calendar year are the result of drought alleviating spring rains that occurred in the SWRZ in 2017.
In contrast to 2017, 2018 drought intensity was greater for stations with larger climatological S CWT rainfall contributions (R2=0.11; p<0.001; for the 2018 calendar year: R2=0.18; ) but dampened by greater climatological contributions from the W–NW CWTs (R2=0.17; ). Similarly, %AMJJAS was associated with reduced drought severity in 2018 (R2=0.11; for the calendar year: R2=0.18). These relationships hold also within the core (for the S CWT: R2=0.19; p<0.005; for W–NW CWTs: R2=0.19; p<0.005). This suggests a reversal of the 2015 pattern, with relatively more moisture available from westerly sources compared to southerly sources.
By the end of August 2017, extreme drought at the 3-year timescale () had set in across much of the WRZ (Fig. 4). The worst-affected areas at this stage were in the core, as reflected in the aggregated data (Fig. 1). In 2018, very severe long-term drought (; τ36≳40 years) spread to affect more stations in the north and east, while stations in the south-west generally saw increases in SPI36. At the 36-month timescale, the spatial pattern of drought intensity in 2017 exhibits much greater systematic structure than in 2018. The correlation between climatological W_all CWT contributions and SPI36 in August 2017 yields R2=0.42; but R2<0.01 for August 2018. Similarly, for %AMJJAS, the correlations are R2=0.29 in August 2017 and R2=0.01 in August 2018. At the 48-month timescale, the mild drought conditions in the core during 2018, following on the intense drought in 2015 and 2017, lead to very extreme drought (; τ48≳740 years) at many stations (31 out of 105 in total, 24 out of 49 in the core and 30 out of 71 in the true WRZ).

Figure 4Long-term (36- and 48-month, as indicated) SPI at the end of August of the years indicated. Note the difference in scale to Fig. 3.
Figure 5 shows that the general qualitative conclusions drawn from Fig. 3 hold for GPCC data as well. In particular, drought severity peaked in a relatively spatially uniform manner in 2017, 2015 saw drought concentrated in the core, and the drought was isolated and relatively weak in 2016 and shifted to the north and east in 2018. However, 2015 GPCC drought severity peaks along the western coastal belt rather than throughout the southern core as in the WRZ station dataset. Furthermore, in the true WRZ, drought severity is generally lower in GPCC than the WRZ station dataset, whereas transitional areas exhibit lower SPI values in GPCC. A spatially representative centennial-scale station dataset would need to be developed to assess the degree to which this latter discrepancy is caused by the relatively short period covered by our station dataset. The GPCC data further show that the 2017–2018 drought extent was largely limited to the WRZ, year-round rainfall zone (YRZ) and transitional extended and very late summer rainfall zones (see Conradie et al., 2022, for definitions). In addition, it is apparent that the drought evolution in the southern surroundings in the WRZ station dataset largely mirrors that of the rest of the coastal YRZ – with drought starting later and lasting longer than in the true WRZ. However, the eastern and interior YRZ experienced more severe drought than the western YRZ extension.

Figure 5Twelve-month SPI for the periods ending in August of the years indicated in GPCC data.
The continuation of drought conditions beyond 2017 has been less widely reported (see, however, Kam et al., 2021, for a spatially aggregated assessment). Presumably this is because drought conditions over the WRZ core – and particularly the mountain catchments of Cape Town's supply reservoirs – were considerably alleviated (see Figs. 1–3), and the immediate Day Zero threat consequently subsided (Wolski et al., 2020). However, such spatio-temporally aggregated assessments mask dry conditions that occurred across the WRZ and surroundings during July and October 2018 and moderately severe drought conditions occurring in many places in the transition and surroundings throughout 2018 (see Figs. 1–4). GPCC data suggest that this pattern continued in an amplified form throughout 2019 (Fig. 6; see also Kam et al., 2021), as near-normal rainfall was observed in most of the WRZ core, but severe drought occurred in the northern periphery and throughout the transition and immediate surroundings. This led to very extreme long-term (36- and 60-month timescales) drought in these regions. There is remarkable consistency in the spatial footprint of drought intensity across timescales in Fig. 6. Although it is difficult to assess at GPCC's 0.25∘ resolution, it appears that drought intensity peaked in the rain shadow valleys of the western interior that are shielded from westerly, southerly and easterly moisture transport. Particularly the Little Karoo of the YRZ has seen SPI6<0 and consistently since autumn 2016 in the GPCC data. Consequently, by December 2019, across much of the Little Karoo. For centennial-scale time series these are alarming statistics that justify focussed analysis and corroboration by station datasets. This is, however, beyond the scope of the present work.
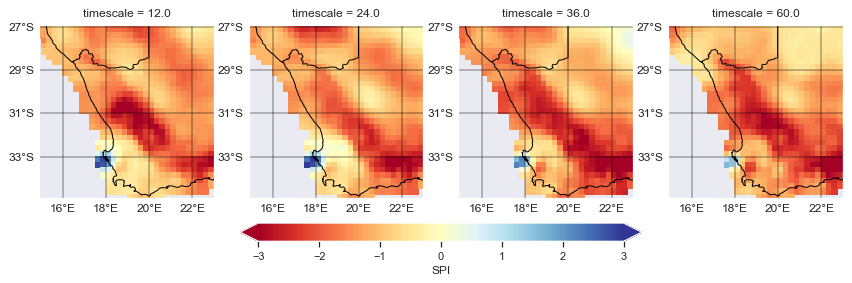
Figure 6GPCC SPI maps for December 2019 for the timescales indicated (in months).
3.3 Where was the drought most intense?
3.3.1 Topography, drought intensity and trends
Wolski et al. (2020) claim that the Day Zero Drought was more intense in the south-western mountains and in particular the mountain catchments of Cape Town's largest reservoirs relative to the surroundings. It has been suggested that the same regions have seen more rapid rainfall and rain day declines in the satellite era (Burls et al., 2019; Wolski et al., 2020). To test these hypotheses more thoroughly, we compute the mean August and December 2017 SPI36 inside the Western Cape Water Supply System (WCWSS) catchment domain (mapped in Fig. A1, as defined by Wolski et al., 2020) and compare it to that obtained from the rest of the WRZ core (mapped in Fig. A3) using both a Student's t test and a two-sample Kolmogorov–Smirnoff (KS) test. The procedure is repeated for rainfall trends. Whereas both SPI36 comparisons and trend rate comparisons show a marginally more negative mean in the WCWSS domain than the rest of the WRZ core, neither difference approaches significance (p>0.3).
We also classify the topography at each station according to two sets of criteria provided in Sect. 2.2.7 and correlate August and December 2017 SPI36 with altitude. When considering the whole WRZ dataset, the core or the true WRZ, the SPI correlation with altitude is not statistically significant (p>0.1), suggesting that altitude was not an important determinant of overall drought severity. When focussing on the core or the true WRZ or considering the whole WRZ dataset, t tests conducted between stations in the different topographic classifications yield no significant differences (p>0.1), and no systematic pattern emerges in mean drought intensity. Theil–Sen rainfall trend rates by station over the period 1979–2018 are also not significantly correlated with elevation, and means do not differ significantly by either topography classification. Combining all “sloped” topography classifications (hilly and mountainous or mountainous, peak, foothills and base) and comparing them to the “flat” groupings also yields no significant difference in SPI or trends in the core or the true WRZ.
Accordingly, the available evidence appears to suggest that the 2015–2017 period saw more intense drought in the WRZ core but that further subdivision does not clearly relate to drought intensity or rainfall trend. The difference in conclusion between this analysis and previous studies is probably related to the fact that the WRZ core was not identified and considered separately in these studies. Hence, these studies are likely to have conflated orographic influences and the contribution of rainfall from winter frontal systems, which characterises the WRZ core (Conradie et al., 2022). However, the caveat that very few stations in the wet high mountains are included in the WRZ dataset (see Conradie et al., 2022) applies here too. Worryingly, both of the two wettest stations in the WCWSS domain (Assegaaibos and Nuweberg) – presumably most representative of the wet high mountain terrain that is the primary water source of the WCWSS – are among the five stations exhibiting significant downward annual rainfall trends at p<0.01.
3.3.2 Revisiting rain day trends in the WRZ
Burls et al. (2019) employ a definition of a rain day occurring in a station set when measurable rain (in their case effectively ≥0.2 mm, since none of the stations they use report rainfall values below this threshold) is recorded at at least one observing station within that station set. We refer to this as a “rain day anywhere” approach. They use two station “clusters”: one “Centennial” cluster of stations with long-term records, mostly including stations around Cape Town and the Swartland plains, the other a “Catchment” cluster, with stations in or near the WCWSS catchment areas and data covering the satellite period (1979–2017, as here). They find that the annual rain day occurrence has decreased much more rapidly in the Catchmentf than the Centennial cluster in the common period (−7.5 vs. +0.8 d yr−1 per decade). However, we find that rain day anywhere occurrence in their two station clusters is particularly sensitive to signals from very rainy stations (i.e. stations with the highest annual rain day climatologies; see Fig. S2a of Conradie et al., 2022). Selecting the stations used by Burls et al. (2019) from the WRZ dataset (henceforth referred to as the Burls stations set), we obtain very similar results, in particular for rain day trends (−7.1 vs. +2.3 d yr−1 per decade; the minor differences observed are most likely attributable to differences in cleaning and gap-filling methodology). When excluding the southernmost stations (south of 34∘ S) from the Catchment cluster (there are no stations south of 34∘ S in the Centennial cluster), many of which are very rainy, and using a 1 mm rather than 0.2 mm rain day cut-off (as there are signs that the recording practices for small rainfall amounts are somewhat inconsistent between manual stations), the rain day trend difference between the two clusters becomes small (−1.6 vs. −0.8 d yr−1 per decade) and occurs mainly in the summer rather than winter half-year. In the Burls stations set, in fact, normalised rain day trend is positively correlated with elevation.
These differences in trend rates are likely to result from the method being sensitive to changes in recording practices, especially related to the recording of cumulative rainfall totals and the day of entry. The sharp decrease in rain days in the Catchment cluster around the year 2000 occurs at a time when both (a) numerous manual recording stations were replaced by automatic stations (e.g. SAAO) and (b) an increase in interannual variability is discernible in the core (see Conradie et al., 2022, Sect. 4.3). On closer inspection, the changes observed largely reflect large rain day reductions in two small rainy subregions into the 21st century: (1) around Table Mountain and (2) the Kogelberg (the southernmost range in the Boland Mountain Complex). Similarly negative trends are found at other WRZ dataset stations in these two subregions not included in the Burls et al. (2019) datasets. These stations tend to have a “winter–spring” rain day climatology (see Conradie et al., 2022, S2b and c). Significantly (p<0.05) negative summer (DJF) rainfall trends are also observed at 7 of the 13 true WRZ stations south of 34∘ S, consistent with the findings of Wolski et al. (2020). It is therefore feasible that the reduction in rain days is related to a reduction in southerly orographic rainfall associated with weak frontal or front-like systems brushing past the southern coastline (often during summer). Such systems, because of their near-zonal orientation, would not be detected by the front-tracking scheme of Burls et al. (2019). This hypothesis will be the subject of a follow-up study with an alternative front-tracking scheme.
Applying the Burls et al. (2019) rain day anywhere methodology with a 1 mm threshold and grouping by the annual variability clusters of Conradie et al. (2022) (mapped in Fig. A2), we find significant negative rain day trends in the S, CPT (p<0.05) and SW (p<0.01) annual variability clusters. Rain day trends are generally most negative in the core, where the mean trend is significantly below 0 (p<0.01). We find little evidence of further systematic patterns to rain day trends by stations, however; correlations with other station properties are weak and inconsistent and there are no apparent patterns to differences in rain day trends between station subgroups. Looking at topography classifications, there is some indication of an increasing rain day trend in the high plateau stations in the north-east, whereas lower-elevation stations at the base of mountainous terrain appear to show the most strongly negative trends. The Burls Catchment cluster stations mostly fall into the WRZ core domain but do also include one station in the Kogelberg region that falls into the southern periphery. Hence, for comparability with Burls et al. (2019), we consider stations in the core and the Kogelberg (in the WRZ dataset, these are Oudebosch and Betty's Bay) together. We find some evidence (p<0.1) that in this domain stations in steeper topography have seen stronger negative rain day trends. However, since multiple comparisons are made, the pattern is somewhat haphazard and significance is limited, it is difficult to draw any robust conclusions. The coherence is even lower when using a 0.2 mm rain day threshold.
3.3.3 Patterns and correlates of rainfall trends in the WRZ
Some relatively robust large-scale patterns in annual rainfall trends emerge. Using a t or KS test, such trends are significantly more negative in the core than in the periphery and surroundings (p<0.01). Trends in the surroundings are, on average, marginally positive. These patterns and their seasonal substructure confirm the qualitative findings of Wolski et al. (2020). However, the clear pattern of decreasing drought intensity from the core to the surroundings is not repeated in rainfall trends. The correlation of annual rainfall trends with %AMJJAS is negative but small (R2≈0.04, p<0.05, although , p<0.005). W_all CWT contributions explain only about 8.5 % of spatial variation in observed rainfall trends (p<0.005), although ; suggests a stronger relationship. The corresponding correlations are negligibly small when considering the core only.
3.3.4 Wind direction frequency and seasonal rainfall trends
There is little trend in overall CWT frequencies. Only for the NE CWT is a marginally significant trend (p<0.05) observed at 0.6 d per decade. Among the three wetter seasons (MAM, JJA and SON), only the JJA WF frequency trend is marginally significant (0.1 d per decade; p<0.05). Given the number of tests conducted, these trends may well be spurious. However, during DJF, significant trend is observed for the CWTs: W (−0.5 d per decade; p<0.01), SW (−1.2 d per decade; p<0.005), SE (0.8 d per decade; p<0.05), E (1.6 d per decade; p<0.05) and NE (0.4 d per decade; p<0.01). Clearly, winds from the easterly sectors have become more frequent at the expense of those from westerly sectors in summer. This is emphasised by the highly significant trends observed in the frequency of W_all (−1.7 d per decade or a 25 % reduction over 40 years; ) and E_all (2.7 d per decade or a 22 % increase over 40 years; p<0.005) CWTs. Furthermore, the frequency of W_all CWTs during DJF is relatively strongly correlated with DJF rainfall in the CPT annual variability cluster (R2=0.22; p<0.01) and moderately with that in the WRZ core (R2=0.14; p<0.05; ρS=0.30; p<0.1). Corresponding reductions in WRZ core and CPT annual variability cluster DJF rainfall also occurred (a roughly 40 % reduction in both cases; ). These are the only seasonal trends in aggregated WRZ core rainfall that are significant at the 5 % level. Across the WRZ dataset, we find a very strong association between DJF drying and the climatological W_all CWT DJF rainfall contributions (R2=0.65; ; ). Even when restricting consideration to the core, this relationship is strong (R2=0.28; p<0.005). This suggests that a reduction in westerly wind frequency during DJF has led to a distinct reduction in DJF rainfall in the WRZ core – and particularly the southern core.
4.1 Data quality considerations
Using a denser, comprehensively cleaned and gap-filled station dataset, we show that some findings regarding droughts and trends in the WRZ are sensitive to station selection, data quality and thresholds employed. Of specific interest is the increased frequency of low-intensity rainfall events occurring at stations where a manual rain gauge was replaced by an automatic one (mostly between 1997 and 2002), missing values recorded as zeroes at some stations over certain periods, wet day biases in missing data, and cumulative rainfall totals recorded as daily figures. In particular, we question the robustness of the claims that drought intensity was greater and rain day frequencies have decreased more rapidly in Cape Town's mountain catchments than their immediate surroundings in the WRZ core (see Burls et al., 2019, and Wolski et al., 2020). Addressing these questions rigorously will require thorough analysis of daily records at the limited number of higher-elevation stations in the WRZ.
4.2 Conceptual models of drought in western South Africa
We now consider whether our findings are consistent with the conceptual model for WRZ drought discussed in Sect. 1. In general, the north-eastward expansion – and progressive shift in the spatial focus – of the Day Zero Drought is not consistent with a single, constant, zonally symmetric drought driver. In Conradie et al. (2022) we find near anti-phase variability at the interannual timescale between the core and southern surroundings, whereas the southern periphery and transitions exhibit an intermediate phase. Together this may indicate the involvement of a low-frequency propagating pattern as a key drought driver. A possible mechanism could be shifts in the quasi-stationary wavenumber-3 and -4 patterns of the Southern Hemisphere subtropical westerly wave; they have been implicated in rainfall variability over both the Western and Eastern Cape provinces of South Africa by Mahlalela et al. (2019, 2020).
The spatial patterns of 12-month drought intensity in both 2015 and 2017 are strongly associated with rainfall seasonality and with the proportion of rainfall received from westerly sources. However, spatial correlations of drought intensity with climatological CWT rainfall contributions are near opposite between 2015 and 2018. This finding further supports the hypothesis of distinct drivers dominating at different stages of the Day Zero Drought. It is worthwhile considering what the return interval for events extending over multiple years and rainfall regions due to distinct drivers operating in consecutive years is. To meaningfully address this question, future research would need to identify more clearly these distinct mechanisms and may consider the evolution of previous multi-year drought episodes in the 1920s–1930s and 1960s–1970s as possible analogues. A recent study in south-eastern England found that none of the multi-year droughts in the observational record driven by winter semester precipitation shortfalls could be explained by a single climate driver (Folland et al., 2015). It appears likely that this is also the case over the WRZ, so that research into concurrent and interacting climate drivers (e.g. Quagraine et al., 2019) will likely be essential in understanding medium-term multi-year drought risk.
Whereas the same qualitative relationships with CWT rainfall contributions apply to drought intensity and rainfall and rain day trends, they explain much less of the observed spatial variation in trends. Hence, it appears that the Day Zero Drought severity – particularly in 2015 and 2017 – was more directly tied to a large-scale westerly forcing than recent trend rates in the WRZ. Observed trends are likely more directly tied to fewer winter rain days (Burls et al., 2019) and a general compression of the winter rainy season (Ndebele et al., 2019).
Burls et al. (2019) found that the drought was caused primarily by a reduction in frontal rainfall associated with a southward shift in the frontal track and enhanced post-frontal subsidence. This would likely also lead to a lack of equatorward penetration of frontal systems that did occur. The negative correlations between latitude and August 2017 SPI12 are therefore to be expected for the peak of drought intensity. More broadly, this correlation is consistent with the finding that the Day Zero Drought was primarily driven by anthropogenically forced dynamic shifts. Furthermore, non-frontal rainfall during winter 2015 – with greater relative impact outside the WRZ core – meant that for the 36-month period to December 2017 and the 48-month period to December 2018, there is essentially no correlation (R2<0.01) between latitude and drought intensity. This implies that competing factors need to be accounted for in projecting rainfall changes in the northern WRZ periphery (cf. MacKellar et al., 2014). Dramatic and ecologically impactful changes in rainfall characteristics may be hidden when considering MAR exclusively (cf. Helme and Schmiedel, 2020).
Post-frontal subsidence helps explain rainfall reductions and enhanced drought severity in the WRZ core. It could also help explain reduced drought severity, especially during 2015, along the southern coast and southern WRZ periphery, where orographic rainfall tends to occur with post-frontal ridging (cf. Engelbrecht et al., 2015). However, this mechanism is not consistent with the enhanced drought severity in the southern and south-eastern WRZ in 2018 or the severe south coast drought in 2017. This further supports the hypothesis of distinct drivers dominating at different times during the Day Zero Drought.
Reduced drought intensity in the CPT annual variability cluster (see Fig. A2) since spring 2017 may be related to the fact that weak front-like systems which penetrate minimally inland tend to bring rainfall to the immediate surroundings of Cape Town exclusively. Significant early spring (ASO) rainfall was limited to the CPT annual variability cluster in 2017 and 2018. A thorough analysis of the characteristics of frontal and front-like systems and their relation to spatial patterns of rainfall would need to be conducted to test these hypotheses.
4.3 Summer season drying in the WRZ core
There is evidence that a reduced frequency of westerly systems during summer is a key driver of reduced summer rainfall in the WRZ core. This is possibly linked to the strong Southern Annular Mode trends during DJF (Fogt and Marshall, 2020) and associated changes in the hemispheric frontal track (Rudeva and Simmonds, 2015). This finding is consistent with those of Conradie et al. (2022) regarding the unique dynamics of summer precipitation in the WRZ core. However, it should be borne in mind that this finding, while supported by multiple different correlations, emerged out of an analysis of multiple comparisons and may thus be spurious.
4.4 Few very wet days and wet months
The intensity of the Day Zero Drought in the WRZ core was as much a consequence of few very wet days and months as it was of very dry months or prolonged sequences of dry days (see Sect. 3.1). This is consistent with the finding of Burls et al. (2019) that the Day Zero Drought period saw a distinct reduction in rainfall intensity but little change in rain day frequency relative to the observed long-term trend. Blamey et al. (2017) show that a large proportion of the most intense rainfall events in the WRZ core between 1979 and 2014 were associated with atmospheric rivers (ARs). In a follow-up study (Sousa et al., 2018), they show that the South Atlantic moisture corridor – in which ARs affecting the WRZ tend to form – was located substantially southward of its climatological location. This led to fewer land-falling ARs, which could explain the reduced frequency of very wet days and months. Understanding low-frequency modulations and trends in AR drivers justifies further exploration.
A preliminary assessment of GPCC data indicates that previous severe multi-year droughts (especially in the late 1920s and early 1930s; see Wolski et al., 2020, and Pascale et al., 2020) were also characterised by severe early winter rainfall shortfalls and a near absence of very wet months. These characteristics may therefore be directly related to low-frequency internal modes of rainfall variability. Future studies investigating the spatio-temporal evolution of these earlier droughts and distinguishing characteristics that the Day Zero Drought shares with earlier droughts from those unique to the most recent event could help determine the drought characteristics driven by low-frequency quasi-cyclic variability from those reflecting an emerging anthropogenic signal (Otto et al., 2018; Pascale et al., 2020).
The importance of wet months in determining drought severity, in combination with the markedly different spatial footprint of drought in 2015 and 2018, suggests that aggregated drought period anomalies of dynamic variables may not reveal persistent patterns. Rather, they may reflect short, intense anomalies driving extreme drought seasons (e.g. Mahlalela et al., 2019) dampened by intervening periods of moderately dry to near-normal conditions. Low autocorrelations in spatially aggregated monthly and seasonal rainfall series also suggest little persistence in driving anomalies. This is not encouraging for the prospect of potential predictability of future drought in the WRZ core. However, the presence of low-frequency variability suggests longer-term persistence may occur. Further investigation is required to unpack this apparent inconsistency.
We apply the subregional framework introduced by Conradie et al. (2022) to study the temporal evolution and spatial patterns of drought intensity and recent rainfall and rain day trends in the WRZ. In addition to the Day Zero Drought period in the true WRZ being characterised by very severe autumn rainfall shortfalls (see also e.g. Mahlalela et al., 2019), a remarkable sequence without moderately wet winter months and few very wet days was central to the unprecedented drought intensity. Largely, our results concur with previous studies that the drought was most intense in the WRZ core (Burls et al., 2019; Wolski et al., 2020) and that spatial and seasonal patterns of drought intensity and rainfall trends show some similarities (Wolski et al., 2020). We show that overall drought intensity for the 2015–2017 period transitions progressively from most severe in the WRZ core (as defined in Conradie et al., 2022; see also Fig. A3) to least severe in the surroundings. The corresponding drought intensity pattern in the WRZ and its immediate vicinity can be explained largely by the climatological proportion rainfall occurring during AMJJAS or that occurring with westerly systems. Both are linked to greater 12- (in 2015 and 2017) and 36-month (in 2017) drought severity.
However, there was considerable variability in the spatial footprint of the drought. Short-term drought began in the south-western core WRZ in spring 2014 and gradually spread out with north-eastward-shifting peak intensity. The early period of the drought was characterised by the absence of strong westerly rainfall systems. In contrast, the available evidence suggests that 2017 saw a reduced frequency and intensity in all winter-season rainfall systems (Sousa et al., 2018; Burls et al., 2019; Abba Omar and Abiodun, 2020), whereas during 2018 rainfall under southerly and south-easterly flow was markedly suppressed. Accordingly, the spatial extent and severity of drought peaked in 2017, and by 2018 the drought was focussed in the surroundings as recovery started in the WRZ core. This evolving pattern indicates that different mechanisms, possibly obscured by aggregation, were dominant during the drought period, which – in the YRZ and late summer rainfall zone – is still ongoing.
Whereas GPCC data largely confirm the spatial pattern of 2015–2018 WRZ drought observed in our station dataset, these gridded data show more intense long-term drought in the WRZ transition and surroundings and less severe drought in the true WRZ than found in station observations. Severe drought during 2019 in these marginal regions and in the northern periphery, coupled with near-normal rainfall in the core, implies that by 2020 the focus of long-term drought had shifted from the core into the margins and surroundings of the WRZ. Thorough assessment of the intensity, drivers and likelihood of future recurrence of such an event is justified by the unprecedented severity of multi-year rainfall shortfalls in the centennial-scale GPCC record of the immediate WRZ surroundings. It would also be valuable to ascertain whether the shifting spatial drought footprint is driven by distinct mechanisms or a single propagating mechanism. More generally, the spatial rainfall change footprint of projected future dynamical changes in the WRZ and its surroundings remains underexplored.
A1 Topography classification
The large-scale topographic classification distinguishes between plains, plateaus, hilly and mountainous terrain. Mountainous terrain occurs where an elevation gain or loss of at least 725 m occurs within 5 km from the station and hilly terrain where a change of at least 500 m occurs within 8 km. Other stations are considered to be located on a plain if their elevation is below 750 m and as lying on a plateau otherwise. The localised topographic classification includes the categories base, foothill, peak, mountainous, plateau and lowland. A station is classified as a “base” station if there is no direction in which elevation falls by more than 100 m in the first 1 km and at least one direction in which elevation increases by 300 m within the first 1 km. Stations not classified as base stations are classified as foothill stations if they are further characterised by an elevation of less than 500 m, an elevation change of 200 m within 1 km of the station or 400 m in 2 km in two directions separated by an angle of at least 90∘. Stations not classified as “base” stations are labelled “mountainous” if they lie at an elevation greater than 500 m and see an elevation of change of at least 300 m within 1 km of the station and a drop in elevation of at least 200 m in 1 km in another direction separated from the first by at least 90∘. Peak stations are stations not classified as mountainous or base stations, with an elevation of at least 500 m and an elevation drop of at least 400 m within 2 km of the station. Other stations with elevation greater than 500 m are labelled as “plateau”; other stations below 500 m are labelled as “lowlands”. These classifications are both relatively arbitrary, but given the differences in approach, it is hoped that a systematic topographic pattern in station behaviour could be detected by comparing stations by category or combinations thereof. Elevation and map data are from the same source as Fig. A1.
A2 Software used
The SPI calculations are implemented using the SCI package in R (Stagge et al., 2015; R Core Team, 2018; Gudmundsson and Stagge, 2016). Theil–Sen trends are computed using the zyp package in R (Bronaugh and Werner, 2019).
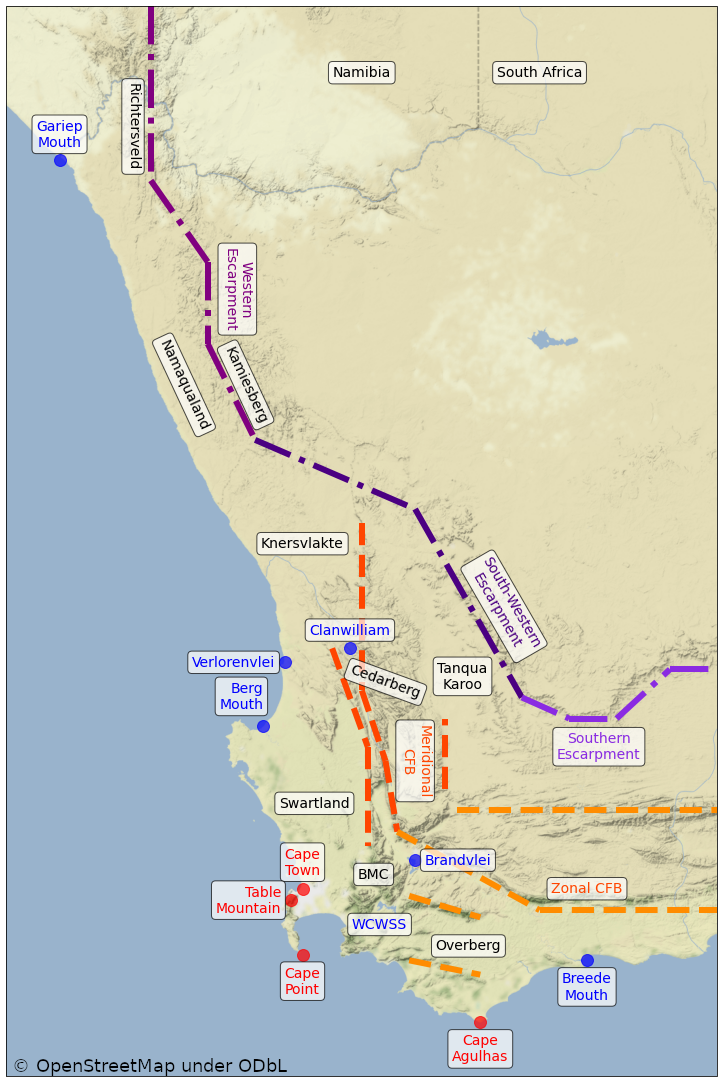
Figure A1Figure 1 of Conradie et al. (2022): topographic map of the region containing the WRZ. Abbreviations are expanded in Sect. A3. Blue labels are for rivers and reservoirs, red labels for point locations and black labels for regions. Purple lines represent the Great Escarpment and orange lines the Cape Fold Belt (CFB). Map tiles are by Stamen Design (http://stamen.com/, last access: 3 March 2022) under CC-BY 3.0 (http://creativecommons.org/licenses/by/3.0, last access: 3 March 2022) and underlying data © OpenStreetMap (http://openstreetmap.org/, last access: 3 March 2022) under ODbL (http://www.openstreetmap.org/copyright, last access: 3 March 2022).
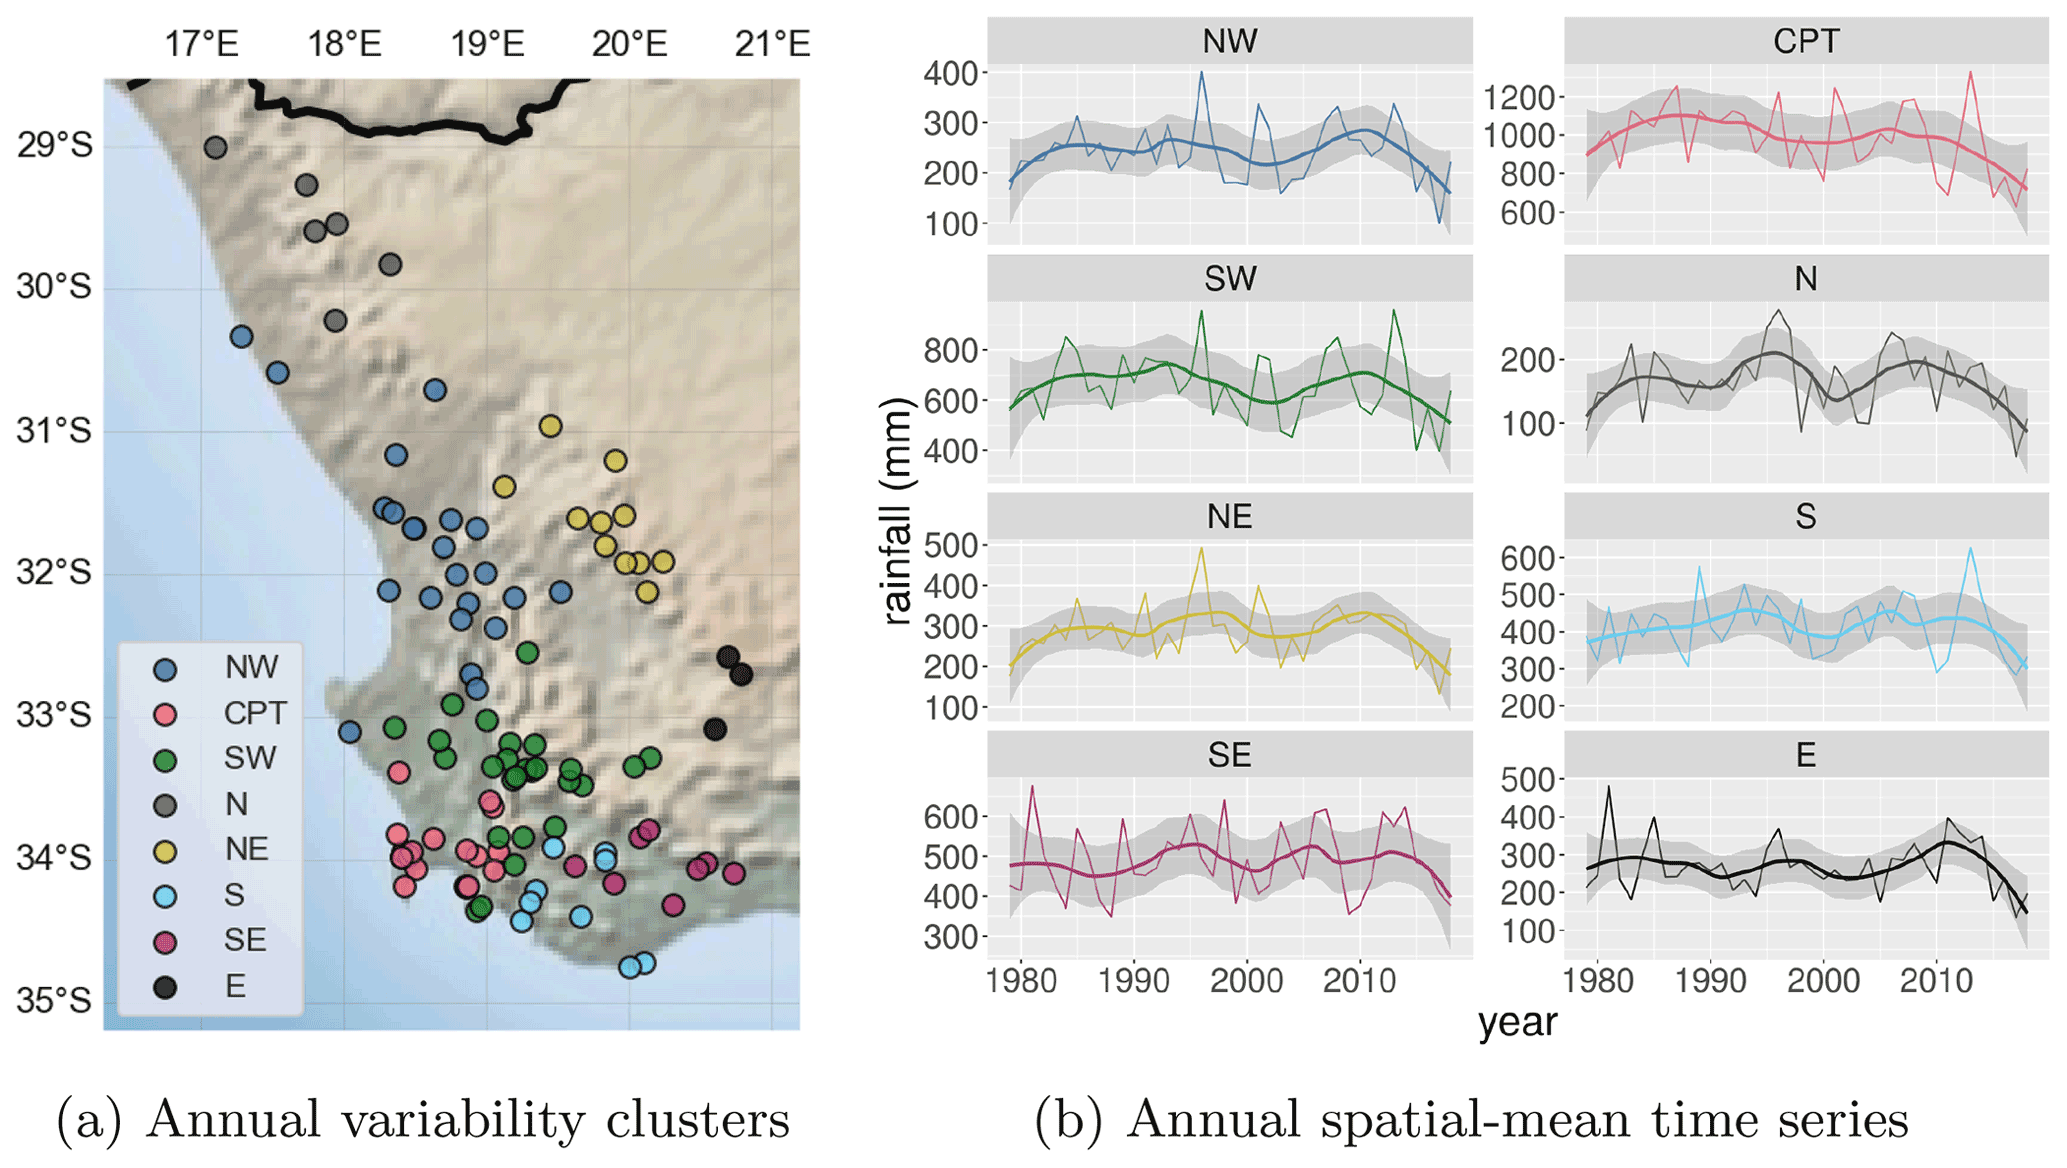
Figure A2Figure 4a and c of Conradie et al. (2022): map and corresponding mean annual time series of annual variability clusters.
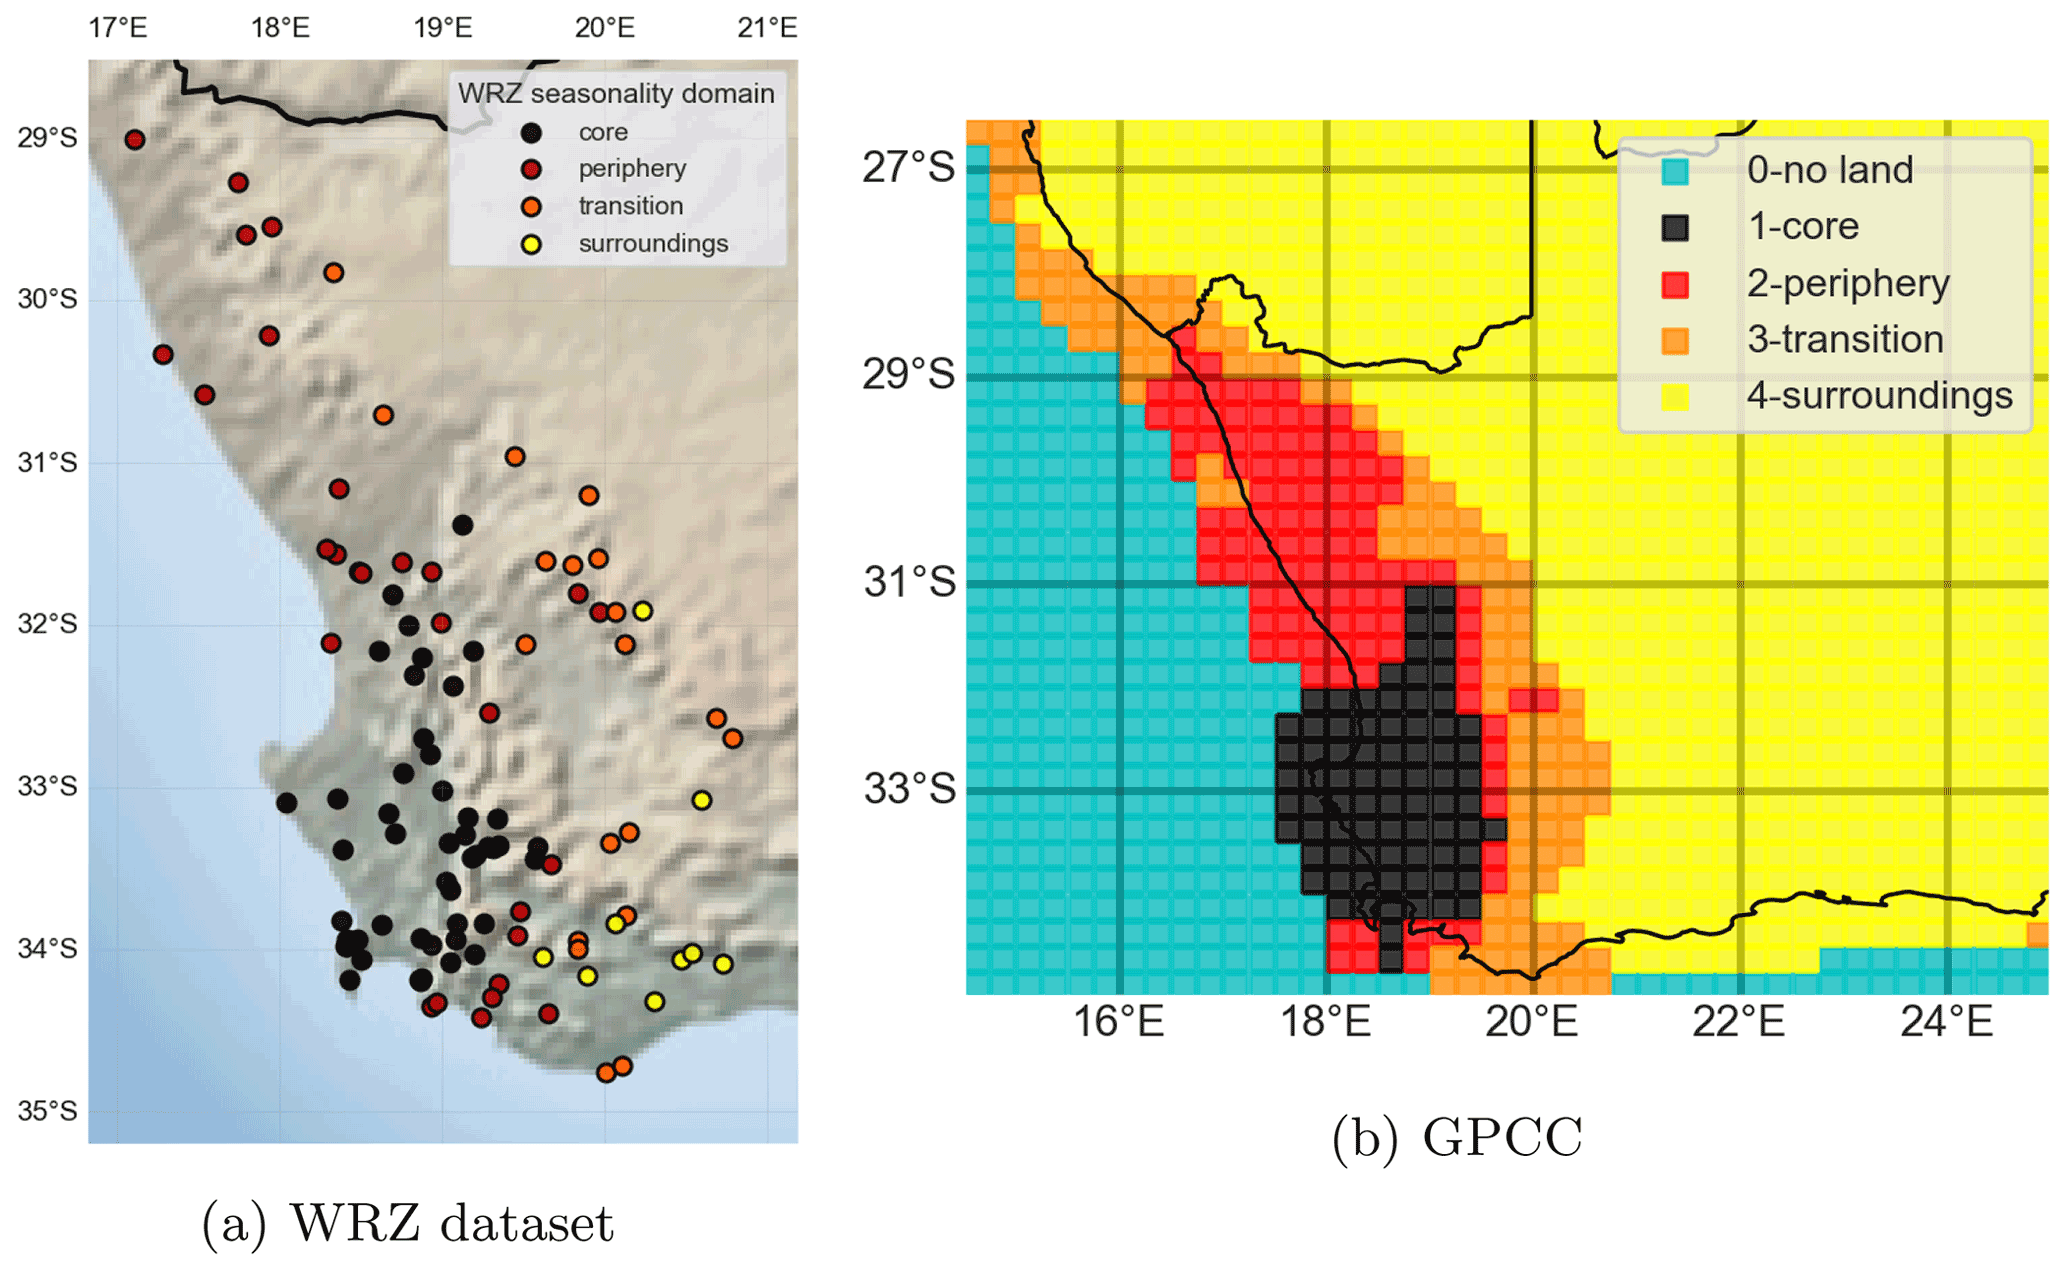
Figure A3Figure 10a and c of Conradie et al. (2022): the simple seasonality domain classification in the WRZ and GPCC datasets.
A3 List of abbreviations used in the text and/or figure labels
| Abbreviation | Expansion |
| Regions | |
| WRZ | Winter rainfall zone of southern Africa |
| YRZ | All-year rainfall zone (also aseasonal or year-round rainfall zone) |
| SRZ | Summer rainfall zone |
| WCWSS | Western Cape Water Supply System |
| CFB | Cape Fold Belt |
| BMC | Boland Mountain Complex |
| Data sources | |
| ECMWF | European Centre for Medium-Range Forecasts |
| ERA5 | ECMWF Re-Analysis 5 |
| GPCC | Global Precipitation Climatology Centre |
| SAWS | South African Weather Service |
| DWS | South African Department of Water Affairs and Sanitation |
| CoCT | City of Cape Town |
| Variables | |
| MAR | Mean annual rainfall |
| %AMJJAS | Percentage of MAR contributed by AMJJAS |
| SPI | Standardised Precipitation Index |
| Weather | |
| COL | Cut-off low |
| IF | Incoherent flow |
| WF | Weak flow |
Most code and data availability is as in Conradie et al. (2022). Code used for SPI analysis can be found here: https://doi.org/10.25375/UCT.16545690.V1 (Conradie et al., 2021). Please note that, as in that paper, the SAWS data policy does not allow sharing or dissemination of their rainfall data. SAWS data can be requested from info4@weathersa.co.za for research purposes in line with their data policy. The GPCC version 2020 rainfall data used to produce the SPI maps can be downloaded from the DWD here: http://dx.doi.org/10.5676/DWD_GPCC/FD_M_V2020_025 (Schneider et al., 2020).
WSC led the conceptualisation and planning of the paper, with input from BCH and PW. Data were obtained by WSC. The code and figures were produced by WSC, with input from PW. The first draft was written by WSC and subsequent editing done by all.
The contact author has declared that neither they nor their co-authors have any competing interests.
Publisher's note: Copernicus Publications remains neutral with regard to jurisdictional claims in published maps and institutional affiliations.
We would like to thank the South African Weather Service for providing most of the rainfall data used in this study. The City of Cape Town is also thanked for supplying rainfall data and the South African National Department of Water and Sanitation for making their rainfall data freely accessible. Stefaan Conradie was partially funded under a RSA National Research Foundation (NRF) grant (121047). Technical support provided by Phillip Mukwenha and Rodger Duffer is greatly appreciated. Helpful review comments from Jan De Waal and an anonymous reviewer improved the clarity of the manuscript appreciably.
This research has been supported by the National Research Foundation (grant no. 121047).
This paper was edited by Michael Wehner and reviewed by Jan de Waal and one anonymous referee.
Abba Omar, S. and Abiodun, B. J.: Characteristics of cut-off lows during the 2015–2017 drought in the Western Cape, South Africa, Atmos. Res., 235, 104772, https://doi.org/10.1016/j.atmosres.2019.104772, 2020. a, b, c
Abba Omar, S. and Abiodun, B. J.: Simulating the characteristics of cut-off low rainfall over the Western Cape using WRF, Clim. Dynam., 56, 1265–1283, https://doi.org/10.1007/s00382-020-05532-8, 2021. a
Altwegg, R., West, A., Gillson, L., and Midgley, G. F.: Impacts of climate change in the Greater Cape Floristic Region, in: Fynbos: ecology, evolution, and conservation of a megadiverse region, edited by: Allsopp, N., Colville, J. F., and Verboom, G. A., Oxford University Press, 299–320, https://doi.org/10.1093/acprof:oso/9780199679584.003.0013, 2014. a, b
Archer, E., Landman, W., Malherbe, J., Tadross, M. A., and Pretorius, S.: South Africa's winter rainfall region drought: A region in transition?, Clim. Risk Manage., 25, 100188, https://doi.org/10.1016/j.crm.2019.100188, 2019. a, b, c
Aschmann, H.: Distribution and Peculiarity of Mediterranean Ecosystems, in: Mediterranean Type Ecosystems, edited by: di Castri, F. and Mooney, H. A., Springer, Berlin, Heidelberg, Chap. 1, 11–19, https://doi.org/10.1007/978-3-642-65520-3_2, 1973. a
Bischoff-Mattson, Z., Maree, G., Vogel, C., Lynch, A., Olivier, D., and Terblanche, D.: Shape of a water crisis: practitioner perspectives on urban water scarcity and “Day Zero” in South Africa, Water Policy, 22, 193–210, https://doi.org/10.2166/wp.2020.233, 2020. a
Blamey, R. C., Ramos, A. M., Trigo, R. M., Tomé, R., and Reason, C. J. C.: The influence of Atmospheric Rivers over the South Atlantic on Winter Rainfall in South Africa, J. Hydrometeorol., 19, JHM-D-17-0111.1, https://doi.org/10.1175/JHM-D-17-0111.1, 2017. a
Bradshaw, P. L. and Cowling, R. M.: Landscapes, rock types, and climate of the Greater Cape Floristic Region, in: Fynbos, Oxford University Press, 26–46, https://doi.org/10.1093/acprof:oso/9780199679584.003.0002, 2014. a
Bronaugh, D. and Werner, A.: R Package zyp, v0.10-1.1, CRAN [code], https://CRAN.R-project.org/package=zyp (last access: 10 March 2022), 2019. a
Burls, N. J., Blamey, R. C., Cash, B. A., Swenson, E. T., al Fahad, A., Bopape, M.-J. M., Straus, D. M., and Reason, C. J. C.: The Cape Town “Day Zero” drought and Hadley cell expansion, npj Climate and Atmospheric Science, 2, 27, https://doi.org/10.1038/s41612-019-0084-6, 2019. a, b, c, d, e, f, g, h, i, j, k, l, m, n, o, p, q, r, s, t
Collins, M., Knutti, R., Arblaster, J., Dufresne, J.-L., Fichefet, T., Friedlingstein, P., Gao, X., Gutowski, W. J., Johns, T., Krinner, G., Shongwe, M., Tebaldi, C., Weaver, A. J., and Wehner, M.: Long-term Climate Change: Projections, Commitments and Irreversibility, Climate Change 2013: The Physical Science Basis. Contribution of Working Group I to the Fifth Assessment Report of the Intergovernmental Panel on Climate Change, Cambridge University Press, Cambridge, United Kingdom and New York, NY, USA, Chap. 12, 1029–1136, https://doi.org/10.1017/CBO9781107415324.024, 2013. a
Conradie, S., Hewitson, B., and Wolski, P.: R code for SPI calculations from monthly gridded or point rainfall data, Ziva Hub [software], https://doi.org/10.25375/UCT.16545690.V1, 2021. a
Conradie, W. S., Wolski, P., and Hewitson, B. C.: Spatial heterogeneity in rain-bearing winds, seasonality and rainfall variability in southern Africa’s winter rainfall zone, Adv. Stat. Clim. Meteorol. Oceanogr., 8, 31–62, https://doi.org/10.5194/ascmo-8-31-2022, 2022. a, b, c, d, e, f, g, h, i, j, k, l, m, n, o, p, q, r, s, t, u, v, w, x, y, z, aa, ab
Du Plessis, J. and Schloms, B.: An investigation into the evidence of seasonal rainfall pattern shifts in the Western Cape, South Africa, J. S. Afr. Inst. Civ. Eng., 59, 47–55, https://doi.org/10.17159/2309-8775/2017/v59n4a5, 2017. a
Engelbrecht, C. J., Landman, W. A., Engelbrecht, F. A., and Malherbe, J.: A synoptic decomposition of rainfall over the Cape south coast of South Africa, Clim. Dynam., 44, 2589–2607, https://doi.org/10.1007/s00382-014-2230-5, 2015. a
Engelbrecht, F. A., McGregor, J. L., and Engelbrecht, C. J.: Dynamics of the Conformal-Cubic Atmospheric Model projected climate-change signal over southern Africa, Int. J. Climatol., 29, 1013–1033, https://doi.org/10.1002/joc.1742, 2009. a
Enqvist, J. P. and Ziervogel, G.: Water governance and justice in Cape Town: An overview, WIREs Water, 6, e1354, https://doi.org/10.1002/wat2.1354, 2019. a
Favre, A., Hewitson, B. C., Lennard, C., Cerezo-Mota, R., and Tadross, M.: Cut-off Lows in the South Africa region and their contribution to precipitation, Clim. Dynam., 41, 2331–2351, https://doi.org/10.1007/s00382-012-1579-6, 2013. a
Fogt, R. L. and Marshall, G. J.: The Southern Annular Mode: Variability, trends, and climate impacts across the Southern Hemisphere, WIREs Clim. Change, 11, e652, https://doi.org/10.1002/wcc.652, 2020. a
Folland, C. K., Hannaford, J., Bloomfield, J. P., Kendon, M., Svensson, C., Marchant, B. P., Prior, J., and Wallace, E.: Multi-annual droughts in the English Lowlands: a review of their characteristics and climate drivers in the winter half-year, Hydrol. Earth Syst. Sci., 19, 2353–2375, https://doi.org/10.5194/hess-19-2353-2015, 2015. a
Gudmundsson, L. and Stagge, J. H.: Package “SCI”: Standardized Climate Indices Such as SPI, SRI or SPEI, v1.0-2, CRAN [code], https://cran.r-project.org/package=SCI (last access: 10 March 2022), 2016. a
Helme, N. and Schmiedel, U.: Namaqualand nightmare, Veld and Flora, 106, 14–19, ISSN 0042-3203, https://botanicalsociety.org.za/d043-veld-flora-june-2020-issue/ (last access: 3 March 2022), 2020. a, b
Hersbach, H., Bell, B., Berrisford, P., Hirahara, S., Horányi, A., Muñoz-Sabater, J., Nicolas, J., Peubey, C., Radu, R., Schepers, D., Simmons, A., Soci, C., Abdalla, S., Abellan, X., Balsamo, G., Bechtold, P., Biavati, G., Bidlot, J., Bonavita, M., De Chiara, G., Dahlgren, P., Dee, D., Diamantakis, M., Dragani, R., Flemming, J., Forbes, R., Fuentes, M., Geer, A., Haimberger, L., Healy, S., Hogan, R. J., Hólm, E., Janisková, M., Keeley, S., Laloyaux, P., Lopez, P., Lupu, C., Radnoti, G., de Rosnay, P., Rozum, I., Vamborg, F., Villaume, S., and Thépaut, J.-N. N.: The ERA5 global reanalysis, Q. J. Roy. Meteorol. Soc., 146, 1999–2049, https://doi.org/10.1002/qj.3803, 2020. a
Hoegh-Guldberg, O., Jacob, D., Bindi, M., Brown, S., Camilloni, I., Diedhiou, A., Djalante, R., Ebi, K., Engelbrecht, F., Guiot, J., Hijioka, Y., Mehrotra, S., Payne, A., Seneviratne, S., Thomas, A., Warren, R., Zhou, G., Halim, S., Achlatis, M., Alexander, L., Allen, M., Berry, P., Boyer, C., Byers, E., Brilli, L., Buckeridge, M., Cheung, W., Craig, M., Ellis, N., Evans, J., Fischer, H., Fraedrich, K., Fuss, S., Ganase, A., Gattuso, J., Greve, P., Bolaños, T., Hanasaki, N., Hasegawa, T., Hayes, K., Hirsch, A., Jones, C., Jung, T., Kanninen, M., Krinner, G., Lawrence, D., Lenton, T., Ley, D., Liverman, D., Mahowald, N., McInnes, K., Meissner, K., Millar, R., Mintenbeck, K., Mitchell, D., Mix, A., Notz, D., Nurse, L., Okem, A., Olsson, L., Oppenheimer, M., Paz, S., Petersen, J., Petzold, J., Preuschmann, S., Rahman, M., Rogelj, J., Scheuffele, H., Schleussner, C.-F., Scott, D., Séférian, R., Sillmann, J., Singh, C., Slade, R., Stephenson, K., Stephenson, T., Sylla, M., Tebboth, M., Tschakert, P., Vautard, R., Wartenburger, R., Wehner, M., Weyer, N., Whyte, F., Yohe, G., Zhang, X., and Zougmoré, R.: Impacts of 1.5 ∘C Global Warming on Natural and Human Systems, IPCC Secretariat, International, Chap. 3, 175–311, 2018. a
Hoffman, M. T., Cramer, M. D., Gillson, L., and Wallace, M.: Pan evaporation and wind run decline in the Cape Floristic Region of South Africa (1974–2005): Implications for vegetation responses to climate change, Climatic Change, 109, 437–452, https://doi.org/10.1007/s10584-011-0030-z, 2011. a
Kam, J., Min, S.-K., Wolski, P., and Kug, J.-S.: CMIP6 Model-Based Assessment of Anthropogenic Influence on the Long Sustained Western Cape Drought over 2015–19, B. Am. Meteorol. Soc., 102, S45–S50, https://doi.org/10.1175/BAMS-D-20-0159.1, 2021. a, b, c
Kruger, A. C. and Nxumalo, M. P.: Historical rainfall trends in South Africa: 1921–2015, Water SA, 43, 285–297, https://doi.org/10.4314/wsa.v43i1.12, 2017. a
MacKellar, N., Hewitson, B. C., and Tadross, M. A.: Namaqualand's climate: Recent historical changes and future scenarios, J. Arid Environ., 70, 604–614, https://doi.org/10.1016/j.jaridenv.2006.03.024, 2007. a, b
MacKellar, N., New, M., and Jack, C.: Observed and modelled trends in rainfall and temperature for South Africa: 1960–2010, S. Afr. J. Sci., 110, 13, https://doi.org/10.1590/sajs.2014/20130353, 2014. a, b
Mahlalela, P. T., Blamey, R. C., and Reason, C. J. C.: Mechanisms behind early winter rainfall variability in the southwestern Cape, South Africa, Clim. Dynam., 53, 21–39, https://doi.org/10.1007/s00382-018-4571-y, 2019. a, b, c, d, e, f, g, h, i, j, k, l
Mahlalela, P. T., Blamey, R. C., Hart, N. C., and Reason, C. J.: Drought in the Eastern Cape region of South Africa and trends in rainfall characteristics, Clim. Dynam., 55, 2743–2759, https://doi.org/10.1007/s00382-020-05413-0, 2020. a
Matikinca, P., Ziervogel, G., and Enqvist, J. P.: Drought response impacts on household water use practices in Cape Town, South Africa, Water Policy, 22, 483–500, https://doi.org/10.2166/wp.2020.169, 2020. a
Maure, G., Pinto, I., Ndebele-Murisa, M., Muthige, M., Lennard, C., Nikulin, G., Dosio, A., and Meque, A.: The southern African climate under 1.5 ∘C and 2 ∘C of global warming as simulated by CORDEX regional climate models, Environ. Res. Lett., 13, 065002, https://doi.org/10.1088/1748-9326/aab190, 2018. a
McKee, T. B., Doesken, N. J., and Kleist, J.: The relationship of drought frequency and duration to time scales, in: Proceedings of the 8th Conference on Applied Climatology, American Meteorological Society Boston, MA, Anaheim, California, USA, 17–22 January 1993, vol. 17, 179–183, 1993. a
Midgley, G. F. and Bond, W. J.: Future of African terrestrial biodiversity and ecosystems under anthropogenic climate change, Nat. Clim. Change, 5, 823–829, https://doi.org/10.1038/nclimate2753, 2015. a
Midgley, G. F. and Thuiller, W.: Potential vulnerability of Namaqualand plant diversity to anthropogenic climate change, J. Arid Environ., 70, 615–628, https://doi.org/10.1016/j.jaridenv.2006.11.020, 2007. a
Myers, N., Mittermeler, R. A., Mittermeler, C. G., Da Fonseca, G. A., and Kent, J.: Biodiversity hotspots for conservation priorities, Nature, 403, 853–858, https://doi.org/10.1038/35002501, 2000. a
Naik, M. and Abiodun, B. J.: Projected changes in drought characteristics over the Western Cape, South Africa, Meteorol. Appl., 27, e1802, https://doi.org/10.1002/met.1802, 2019. a, b
Ndebele, N. E., Grab, S., and Turasie, A.: Characterizing rainfall in the south-western Cape, South Africa: 1841–2016, Int. J. Climatol., 40, joc.6314, https://doi.org/10.1002/joc.6314, 2019. a, b
Niang, I., Ruppel, O. C., Abdrabo, M. A., Essel, A., Lennard, C., Padgham, J., and Urquhart, P.: Africa, in: Climate Change 2014: Impacts, Adaptation and Vulnerability, edited by: Barros, V. R., Field, C. B., Dokken, D. J., Mastrandrea, M. D., and Mach, K. J., Cambridge University Press, Cambridge, 1199–1266, https://doi.org/10.1017/CBO9781107415386.002, 2014. a
Odoulami, R. C., New, M., Wolski, P., Guillemet, G., Pinto, I., Lennard, C., Muri, H., and Tilmes, S.: Stratospheric Aerosol Geoengineering could lower future risk of “Day Zero” level droughts in Cape Town, Environ. Res. Lett., 15, 124007, https://doi.org/10.1088/1748-9326/abbf13, 2020. a
Odoulami, R. C., Wolski, P., and New, M.: A SOM-based analysis of the drivers of the 2015–2017 Western Cape drought in South Africa, Int. J. Climatol., 41, E1518–E1530, https://doi.org/10.1002/joc.6785, 2021. a
Otto, F. E. L., Wolski, P., Lehner, F., Tebaldi, C., Van Oldenborgh, J., Hogesteeger, S., Singh, R., Holden, P., Fučkar, N. S., Odoulami, R. C., and New, M.: Anthropogenic influence on the drivers of the Western Cape drought 2015–2017, Environ. Res. Lett., 13, 124010, https://doi.org/10.1088/1748-9326/aae9f9, 2018. a, b, c
Pascale, S., Kapnick, S. B., Delworth, T. L., and Cooke, W. F.: Increasing risk of another Cape Town “Day Zero” drought in the 21st century, P. Natl. Acad. Sci. USA, 117, 202009144, https://doi.org/10.1073/pnas.2009144117, 2020. a, b, c, d, e, f, g
Polade, S. D., Gershunov, A., Cayan, D. R., Dettinger, M. D., and Pierce, D. W.: Precipitation in a warming world: Assessing projected hydro-climate changes in California and other Mediterranean climate regions, Sci. Rep., 7, 1–10, https://doi.org/10.1038/s41598-017-11285-y, 2017. a, b
Quagraine, K. A., Hewitson, B. C., Jack, C., Pinto, I., and Lennard, C.: A Methodological Approach to Assess the Co-Behavior of Climate Processes over Southern Africa, J. Climate, 32, 2483–2495, https://doi.org/10.1175/JCLI-D-18-0689.1, 2019. a
R Core Team: R 3.4.6: A Language and Environment for Statistical Computing, R Foundation for Statistical Computing, Vienna, Austria, R Core Team [software], 2018. a
Rudeva, I. and Simmonds, I.: Variability and trends of global atmospheric frontal activity and links with large-scale modes of variability, J. Climate, 28, 3311–3330, https://doi.org/10.1175/JCLI-D-14-00458.1, 2015. a
Schneider, U., Becker, A., Finger, P., Rustemeier, E., and Ziese, M.: GPCC Full Data Monthly Product Version 2020 at 0.25∘: Monthly Land-Surface Precipitation from Rain-Gauges built on GTS-based and Historical Data, Federal Ministry of Transport and Digital Infrastructure [data set], https://doi.org/10.5676/DWD_GPCC/FD_M_V2020_025, 2020. a, b
Seager, R., Osborn, T. J., Kushnir, Y., Simpson, I. R., Nakamura, J., and Liu, H.: Climate variability and change of mediterranean-type climates, J. Climate, 32, 2887–2915, https://doi.org/10.1175/JCLI-D-18-0472.1, 2019. a, b, c
Sen, P. K.: Estimates of the Regression Coefficient Based on Kendall's Tau, J. Am. Stat. Assoc., 63, 1379–1389, https://doi.org/10.1080/01621459.1968.10480934, 1968. a
Sousa, P. M., Blamey, R., Reason, C., Ramos, A. M., and Trigo, R. M.: The “Day Zero” Cape Town drought and the poleward migration of moisture corridors, Environ. Res. Lett., 13, 124025, https://doi.org/10.1088/1748-9326/aaebc7, 2018. a, b, c, d, e, f
Stager, J. C., Mayewski, P. A., White, J., Chase, B. M., Neumann, F. H., Meadows, M. E., King, C. D., and Dixon, D. A.: Precipitation variability in the winter rainfall zone of South Africa during the last 1400 yr linked to the austral westerlies, Clim. Past, 8, 877–887, https://doi.org/10.5194/cp-8-877-2012, 2012. a
Stagge, J. H., Tallaksen, L. M., Gudmundsson, L., Van Loon, A. F., and Stahl, K.: Candidate Distributions for Climatological Drought Indices (SPI and SPEI), Int. J. Climatol., 35, 4027–4040, https://doi.org/10.1002/joc.4267, 2015. a
Stagge, J. H., Tallaksen, L. M., Gudmundsson, L., Van Loon, A. F., and Stahl, K.: Response to comment on “Candidate Distributions for Climatological Drought Indices (SPI and SPEI)”, Int. J. Climatol., 36, 2132–2138, https://doi.org/10.1002/joc.4564, 2016. a
Wolski, P.: How severe is Cape Town's “Day Zero” drought?, Significance, 15, 24–27, https://doi.org/10.1111/j.1740-9713.2018.01127.x, 2018. a, b, c, d, e
Wolski, P., Conradie, S., Jack, C., and Tadross, M.: Spatio-temporal patterns of rainfall trends and the 2015–2017 drought over the winter rainfall region of South Africa, Int. J. Climatol., 41, E1303–1319, https://doi.org/10.1002/joc.6768, 2020. a, b, c, d, e, f, g, h, i, j, k, l, m, n, o, p, q
Yue, S., Pilon, P., Phinney, B., and Cavadias, G.: The influence of autocorrelation on the ability to detect trend in hydrological series, Hydrol. Process., 16, 1807–1829, https://doi.org/10.1002/hyp.1095, 2002. a
Ziervogel, G.: Climate Adaptation and Water Scarcity in Southern Africa, Curr. Hist., 117, 181, 2018. a
Day Zerowater crisis affecting Cape Town after the severe 2015–2017 drought motivated renewed research interest into causes and projections of rainfall variability and change in this water-stressed region. Unusually few wet months and very wet days characterised the Day Zero Drought. Its extent expanded as it shifted gradually north-eastward, concurrent with changes in the weather systems driving drought. Our results emphasise the need to consider the interplay between drought drivers.
Day Zerowater crisis affecting Cape Town after the severe 2015–2017 drought motivated...